Profit Report
Scroll down for a detailed guide on how to use this report.
Tiers: Scaling Up and above
Overview
The Profit Report displays and breaks down profits per customer serviced during a select date range.
Step-by-step instructions . . .
- 1
-
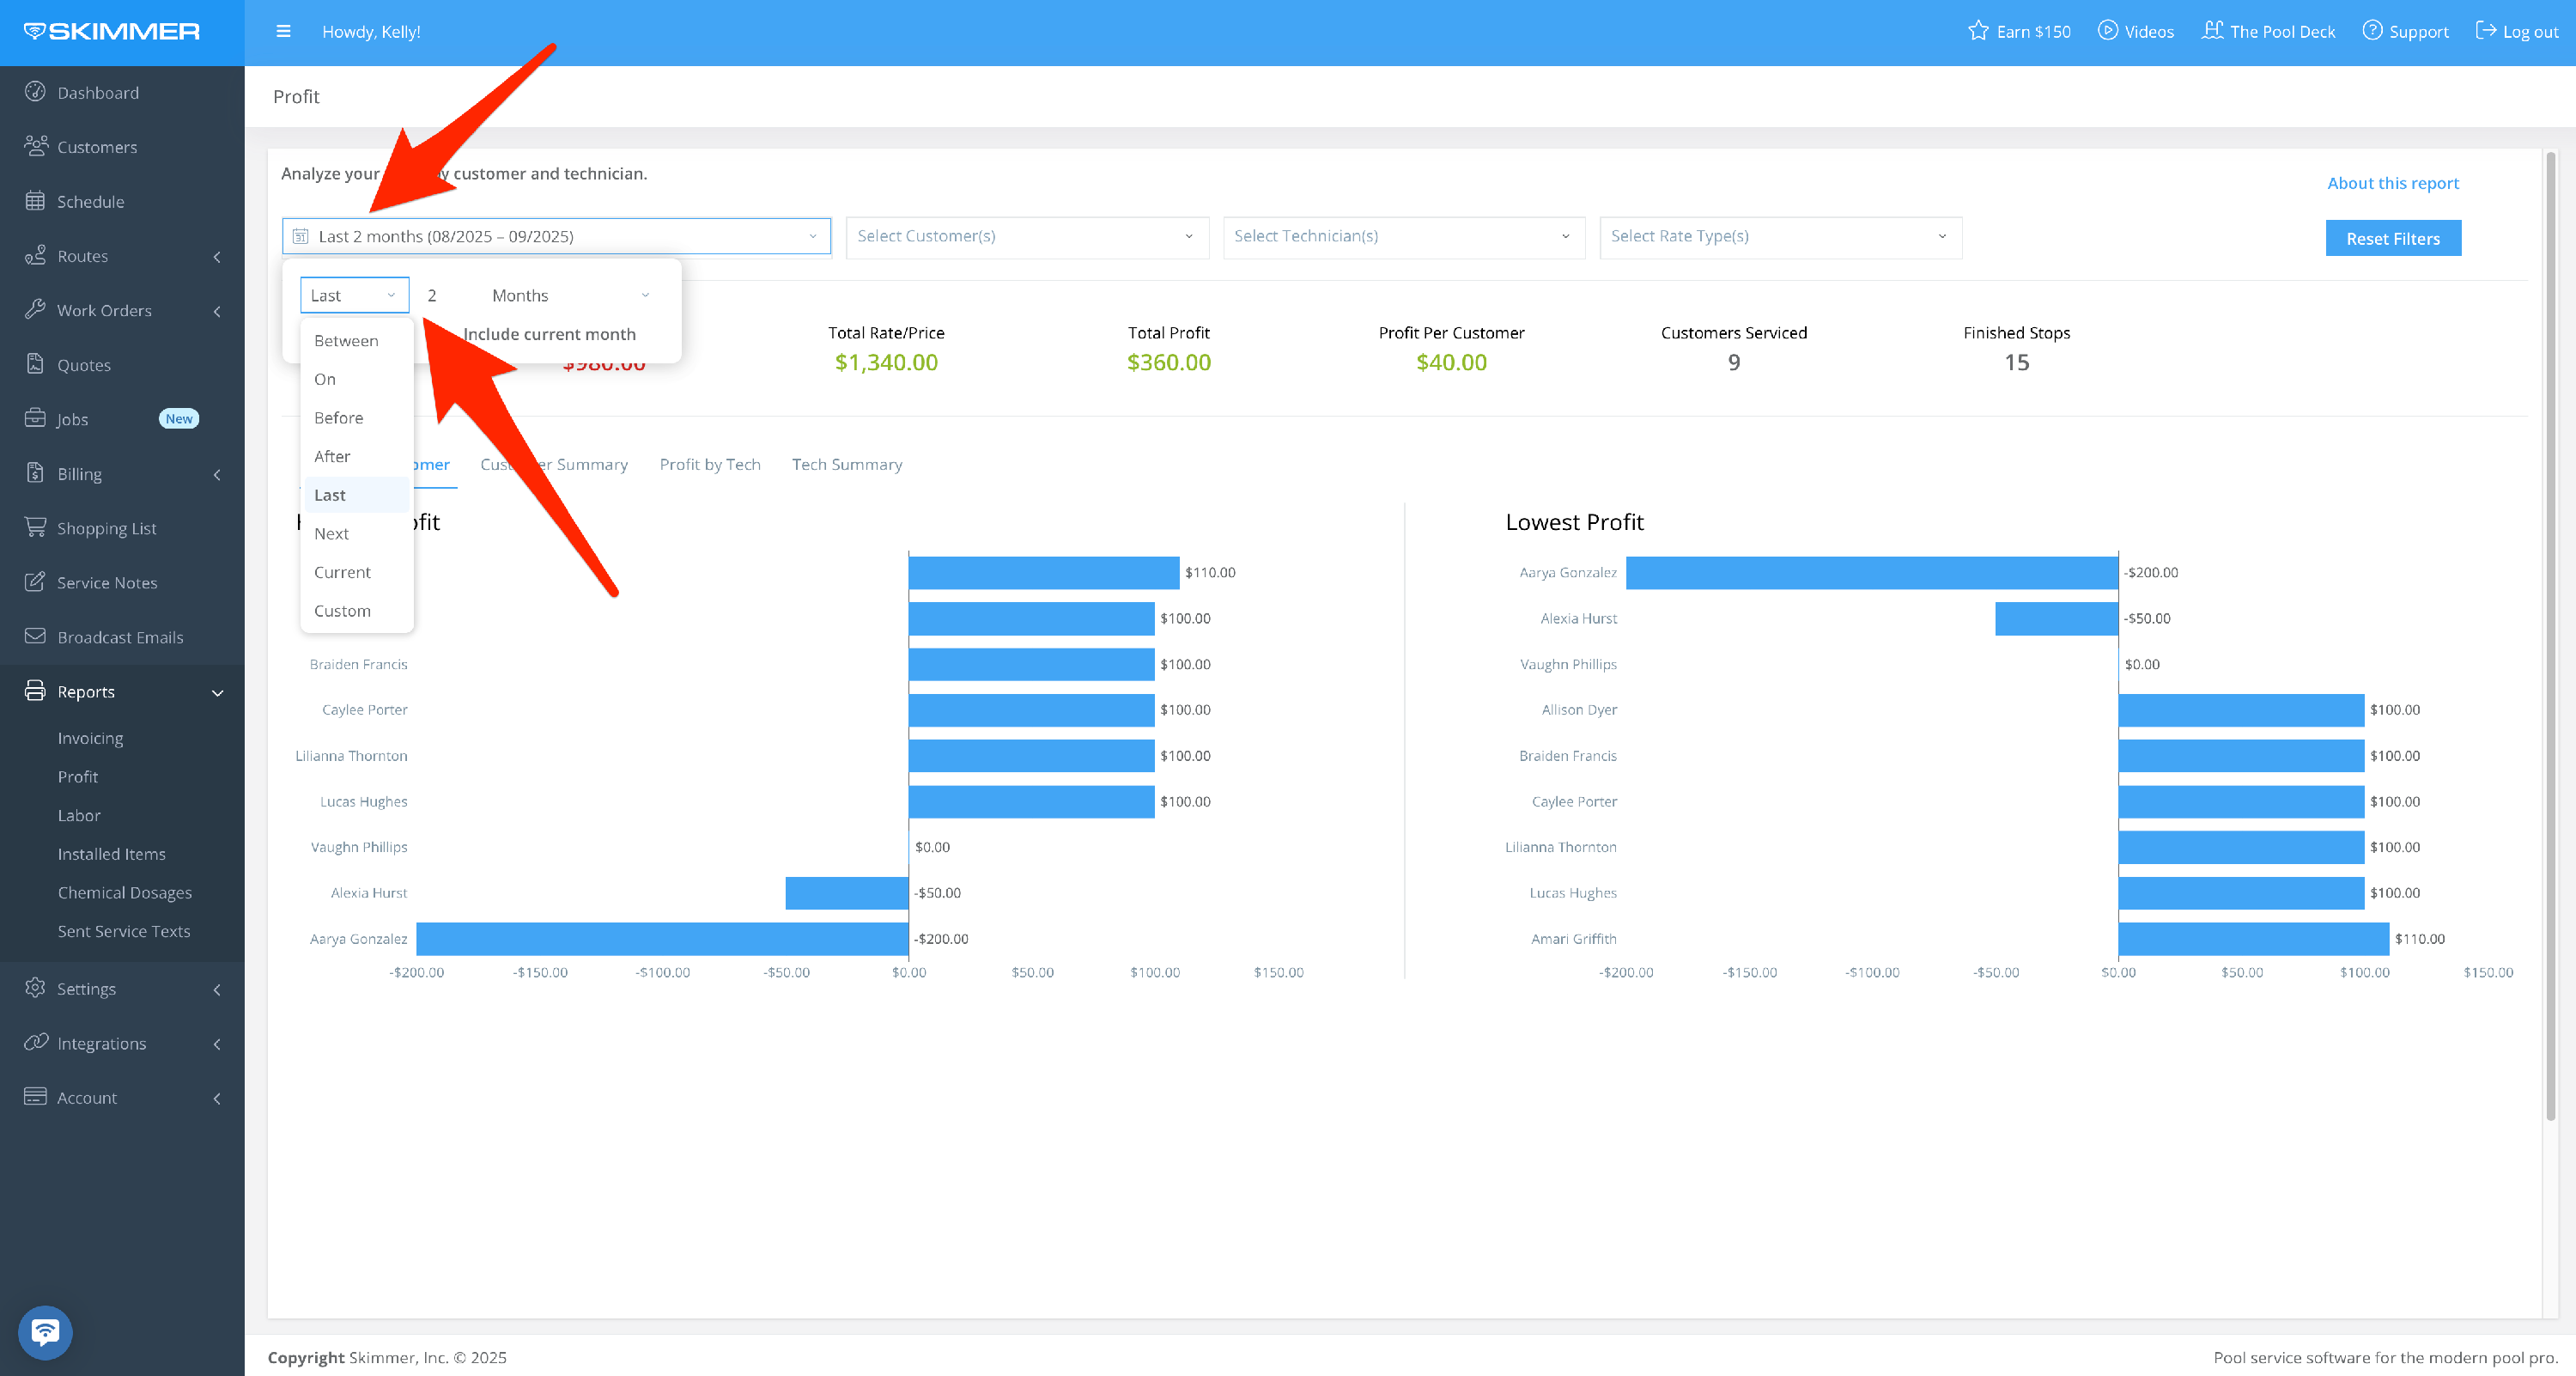
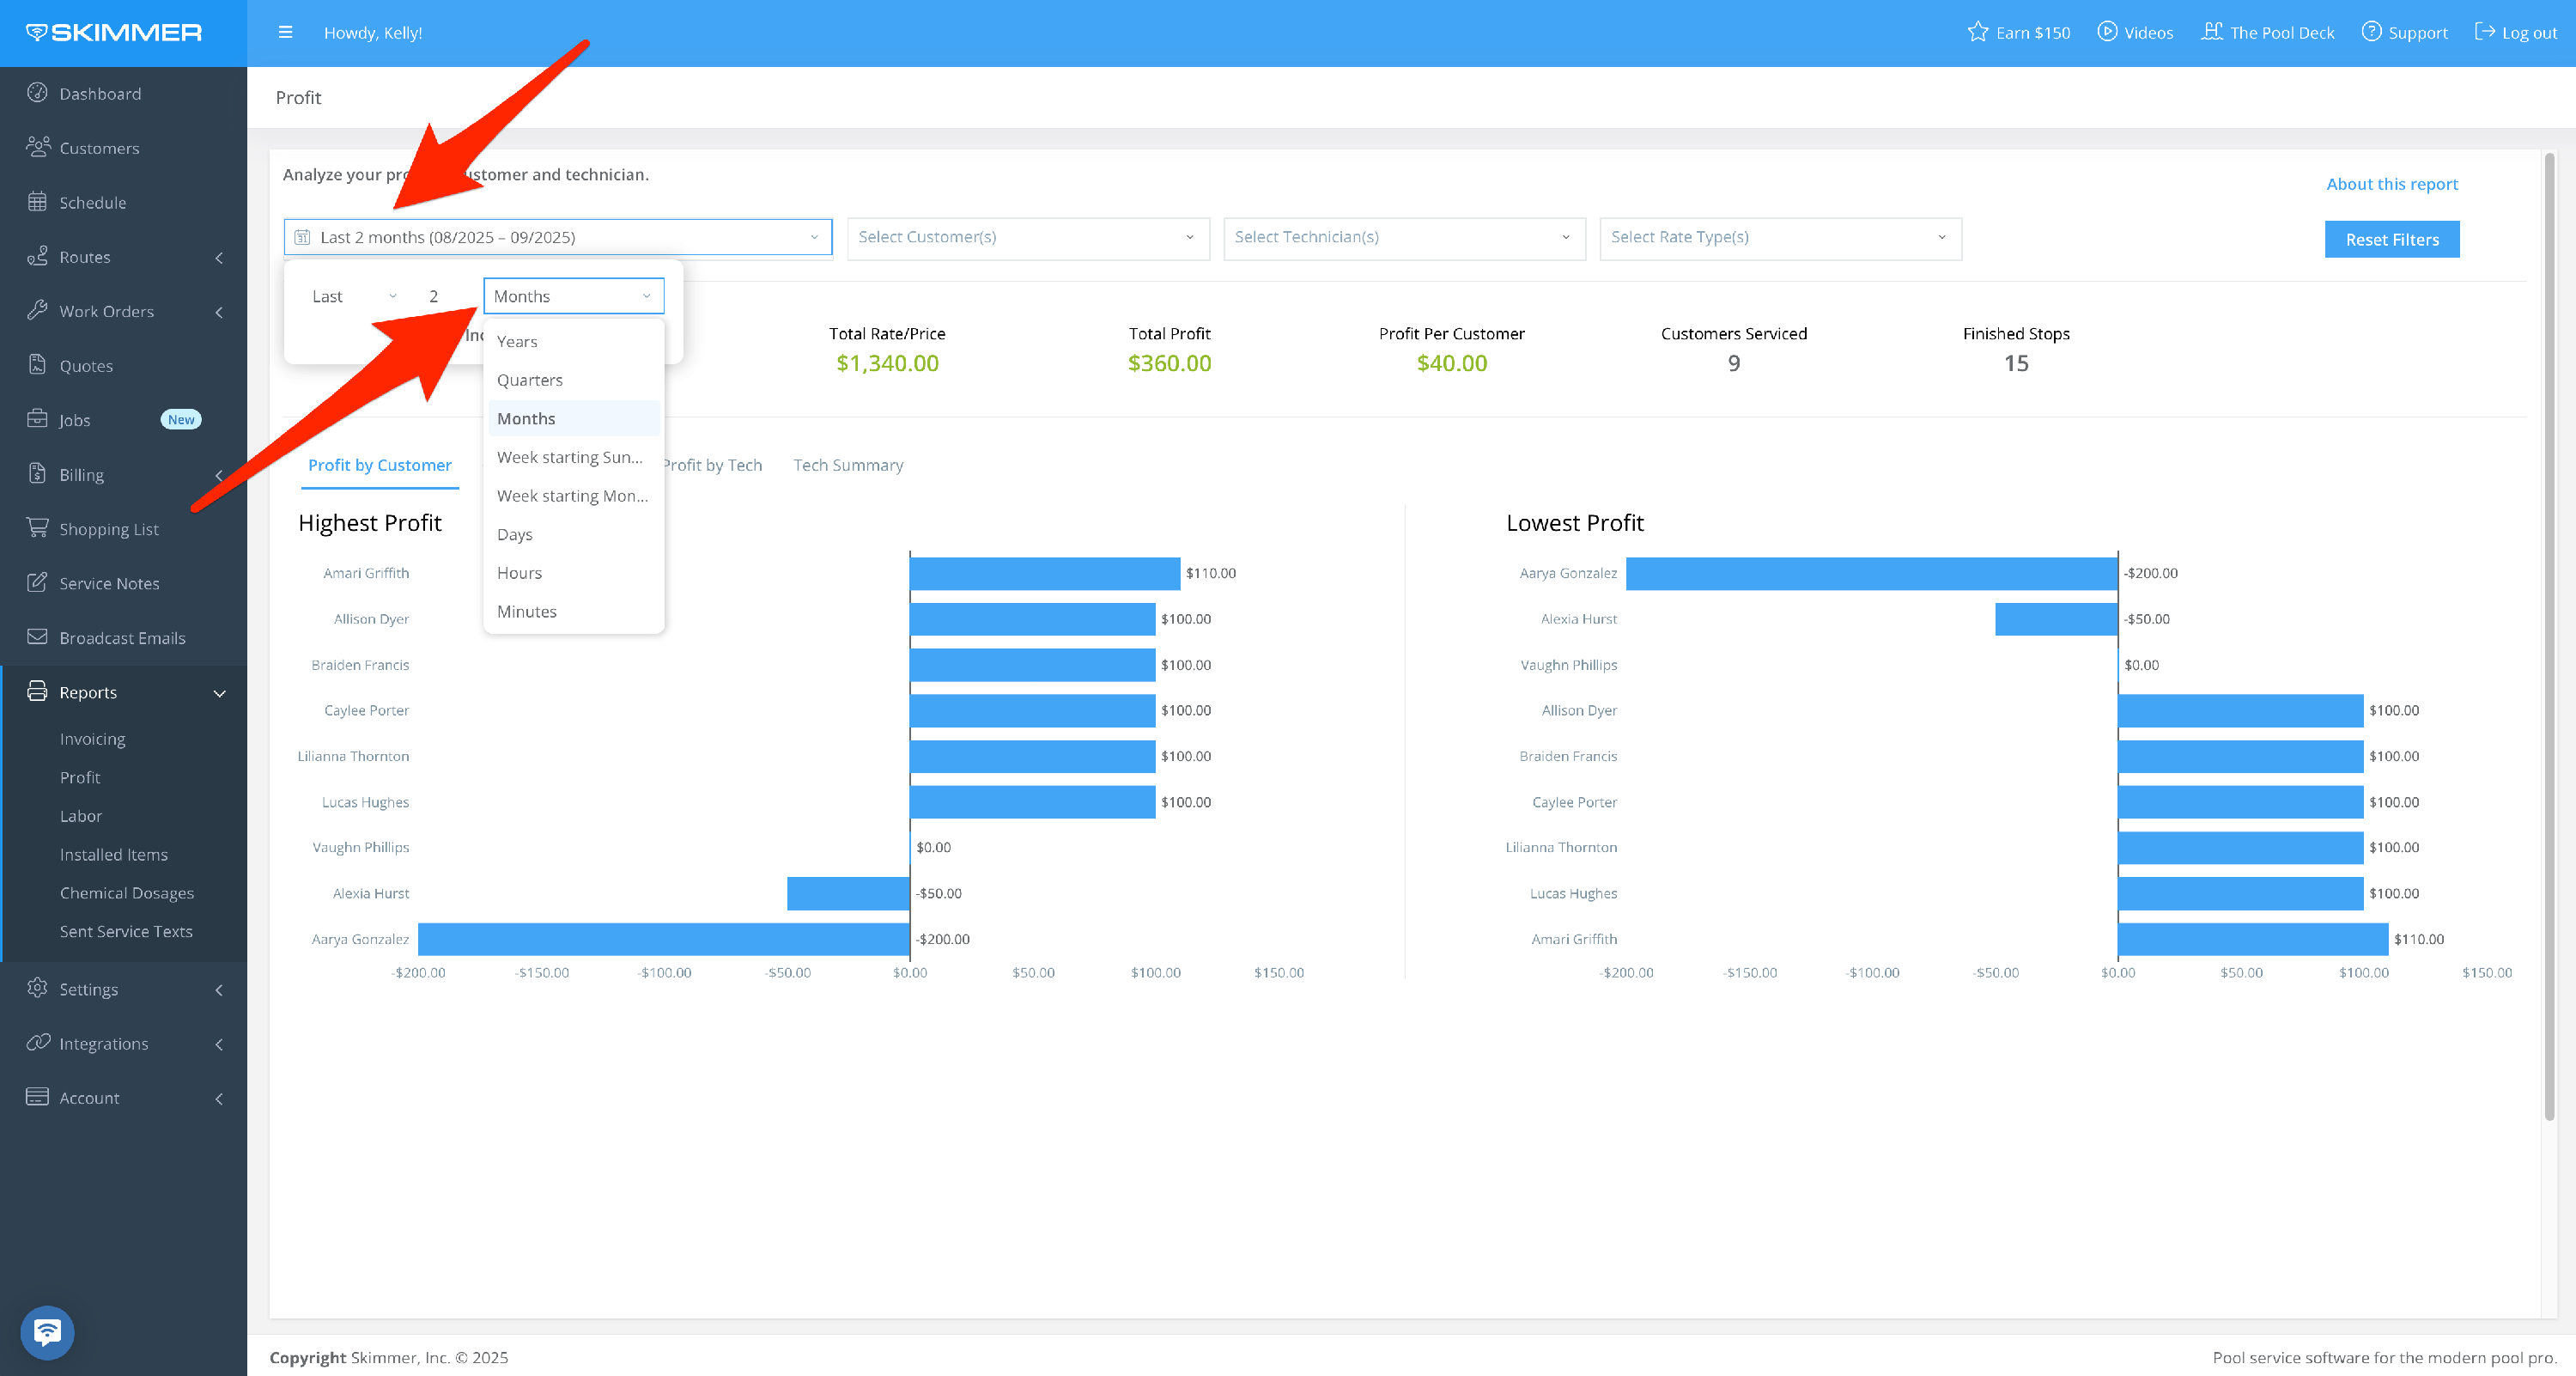
Filter by Date Range:
- Between two dates, creating a date range
- On, before, or after a specific date
- Last sets a time frame going into the past–last day/week/six months/two years, etc. even last hours or minutes, fully customizable
- Current lets you center on now and view by current hour/day/month/quarter, and more
- The Next option does not currently have information associated with it, so you won’t need to select it.
- Note that, if you’re charging any customers on a Per Month rate, it's recommended to select a date range that includes full months so that you can see all completed stops in that month. If, however, you choose to display only a portion of the month, the report will still be accurate for any date you choose.
- 2
-
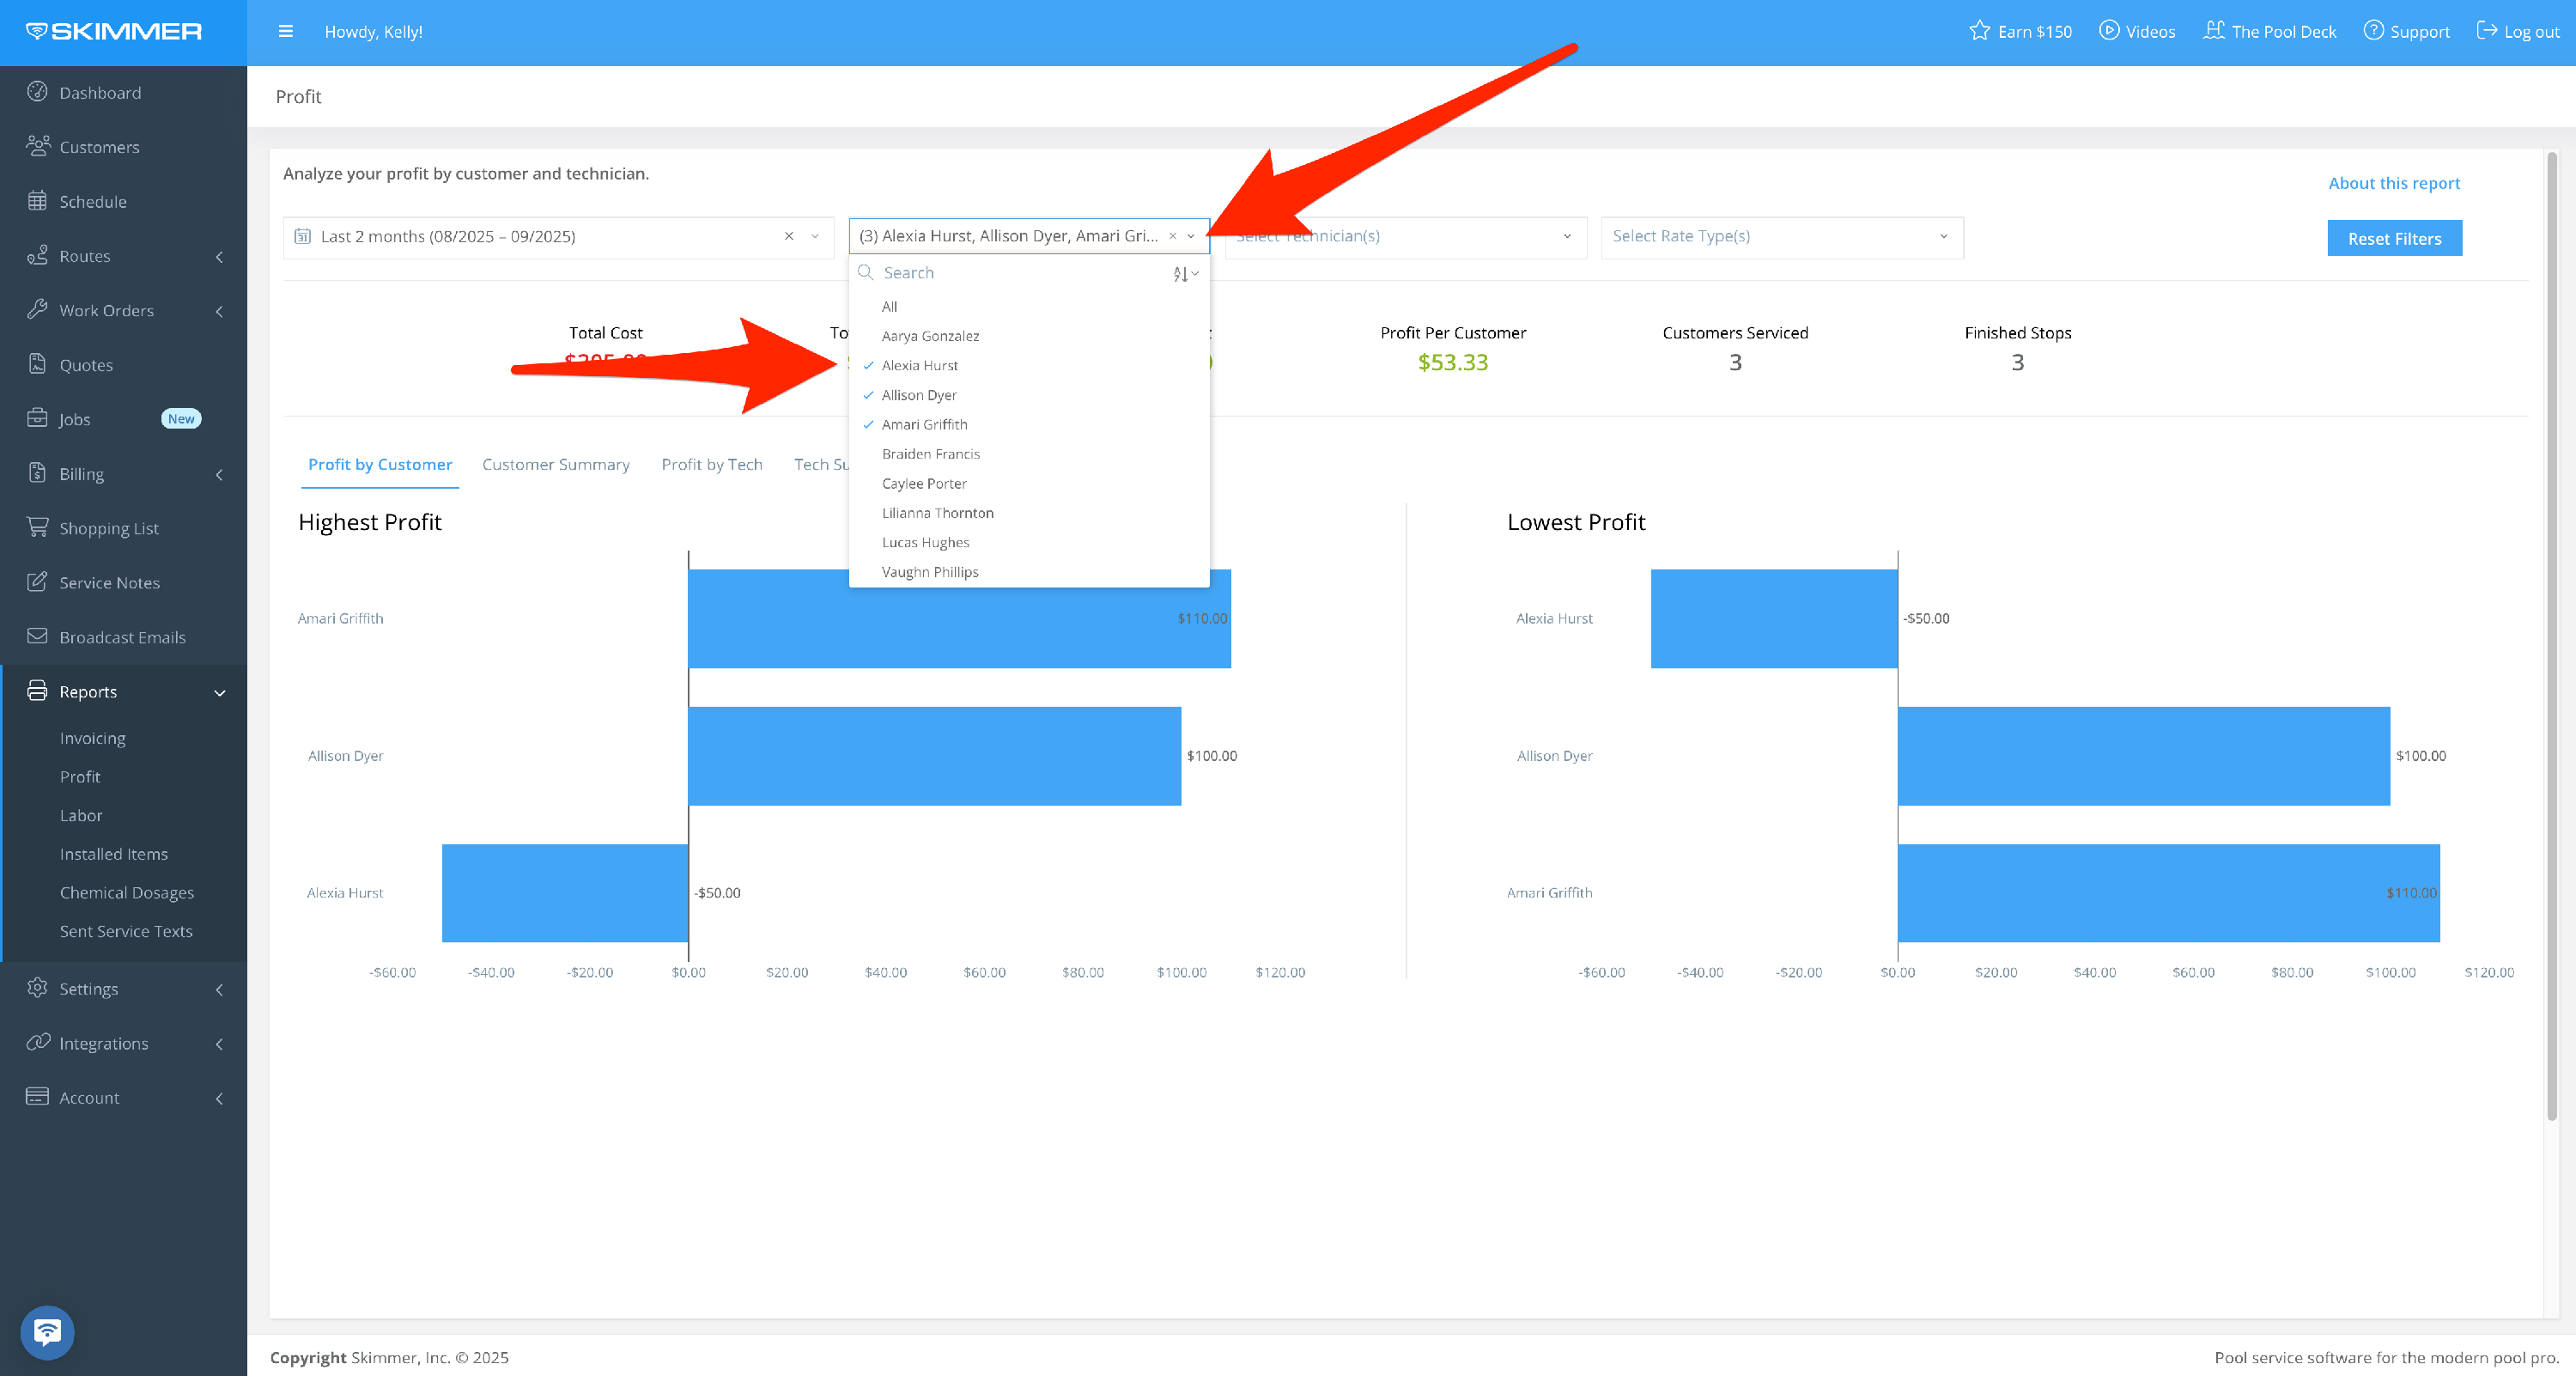
Filter by Customer:
- By customer name
- By multiple customers based on check boxes
- Make your choices and the list filters down, showing the same information as full list for the selected customers
- When you filter by customer, the only customer names that show up in the dropdown are the ones who have received service within the selected time frame
- 3
-
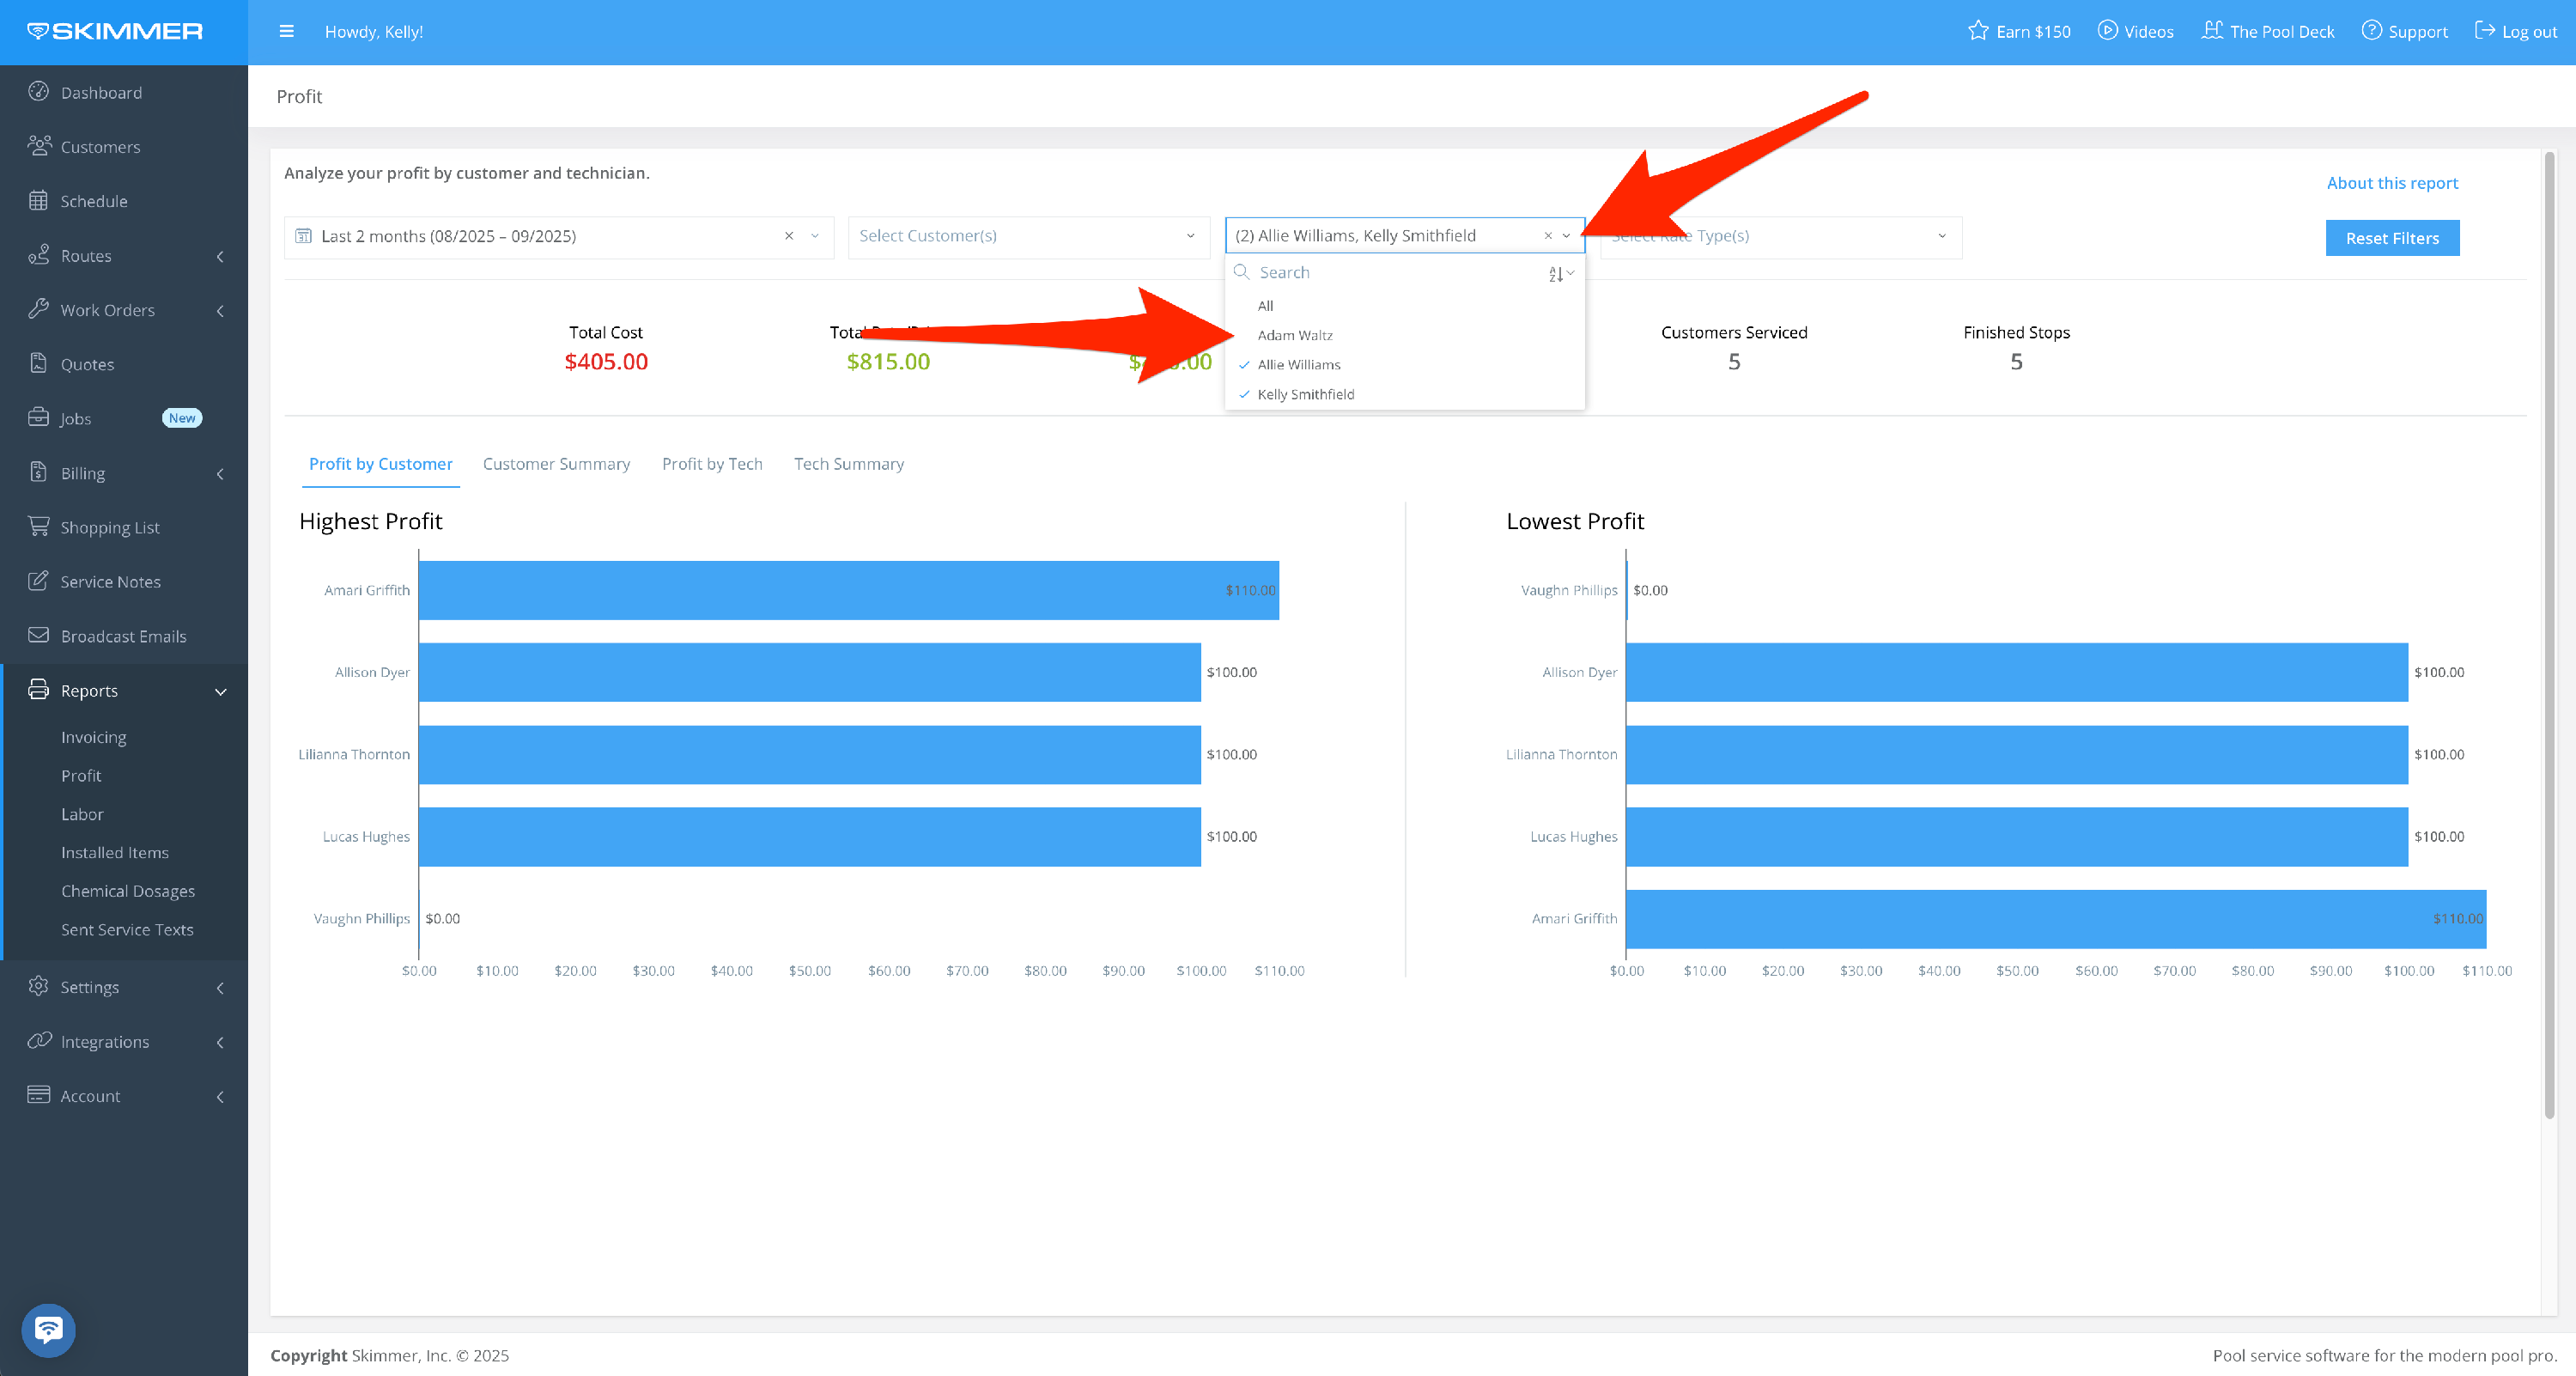
Filter by Technician:
Display profits for work performed by one tech, or a select set of techs. When you filter by tech, the only names that show up in the dropdown are the ones who have performed service within the selected time frame.
- 4
-
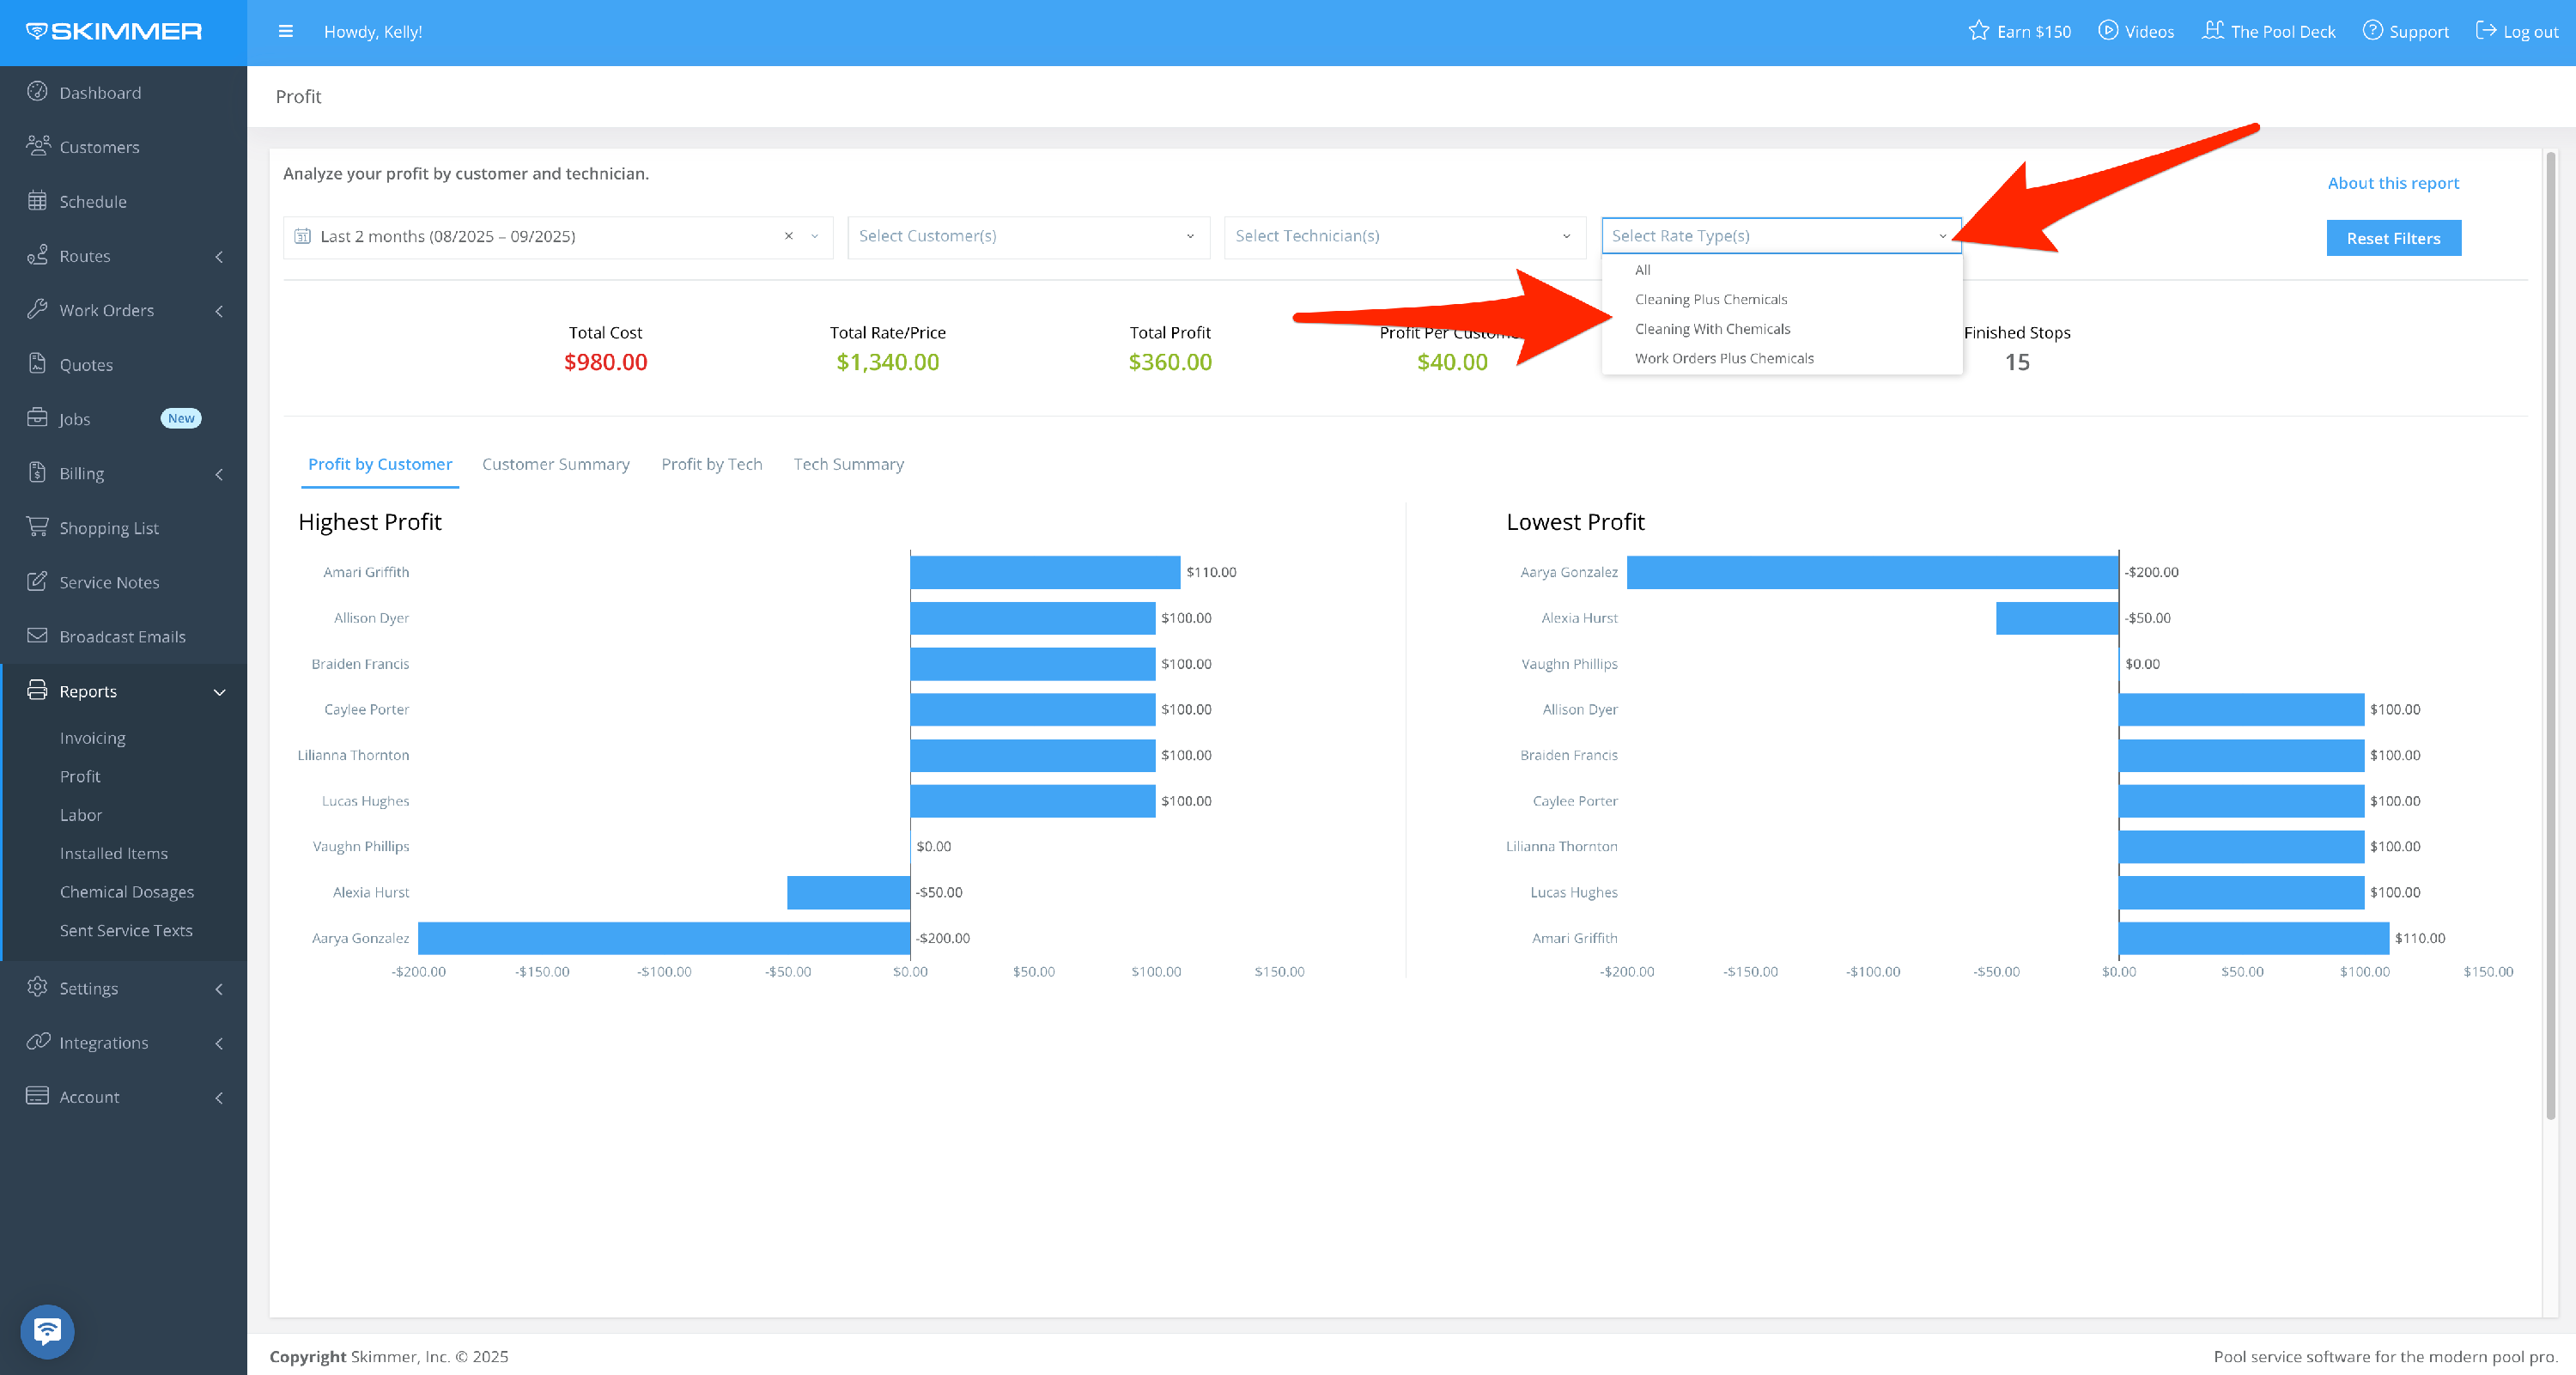
Filter by Rate Type:
- View profits based on how you charge customers
- This report includes work orders, and you can filter to see only those profits
- 5
-
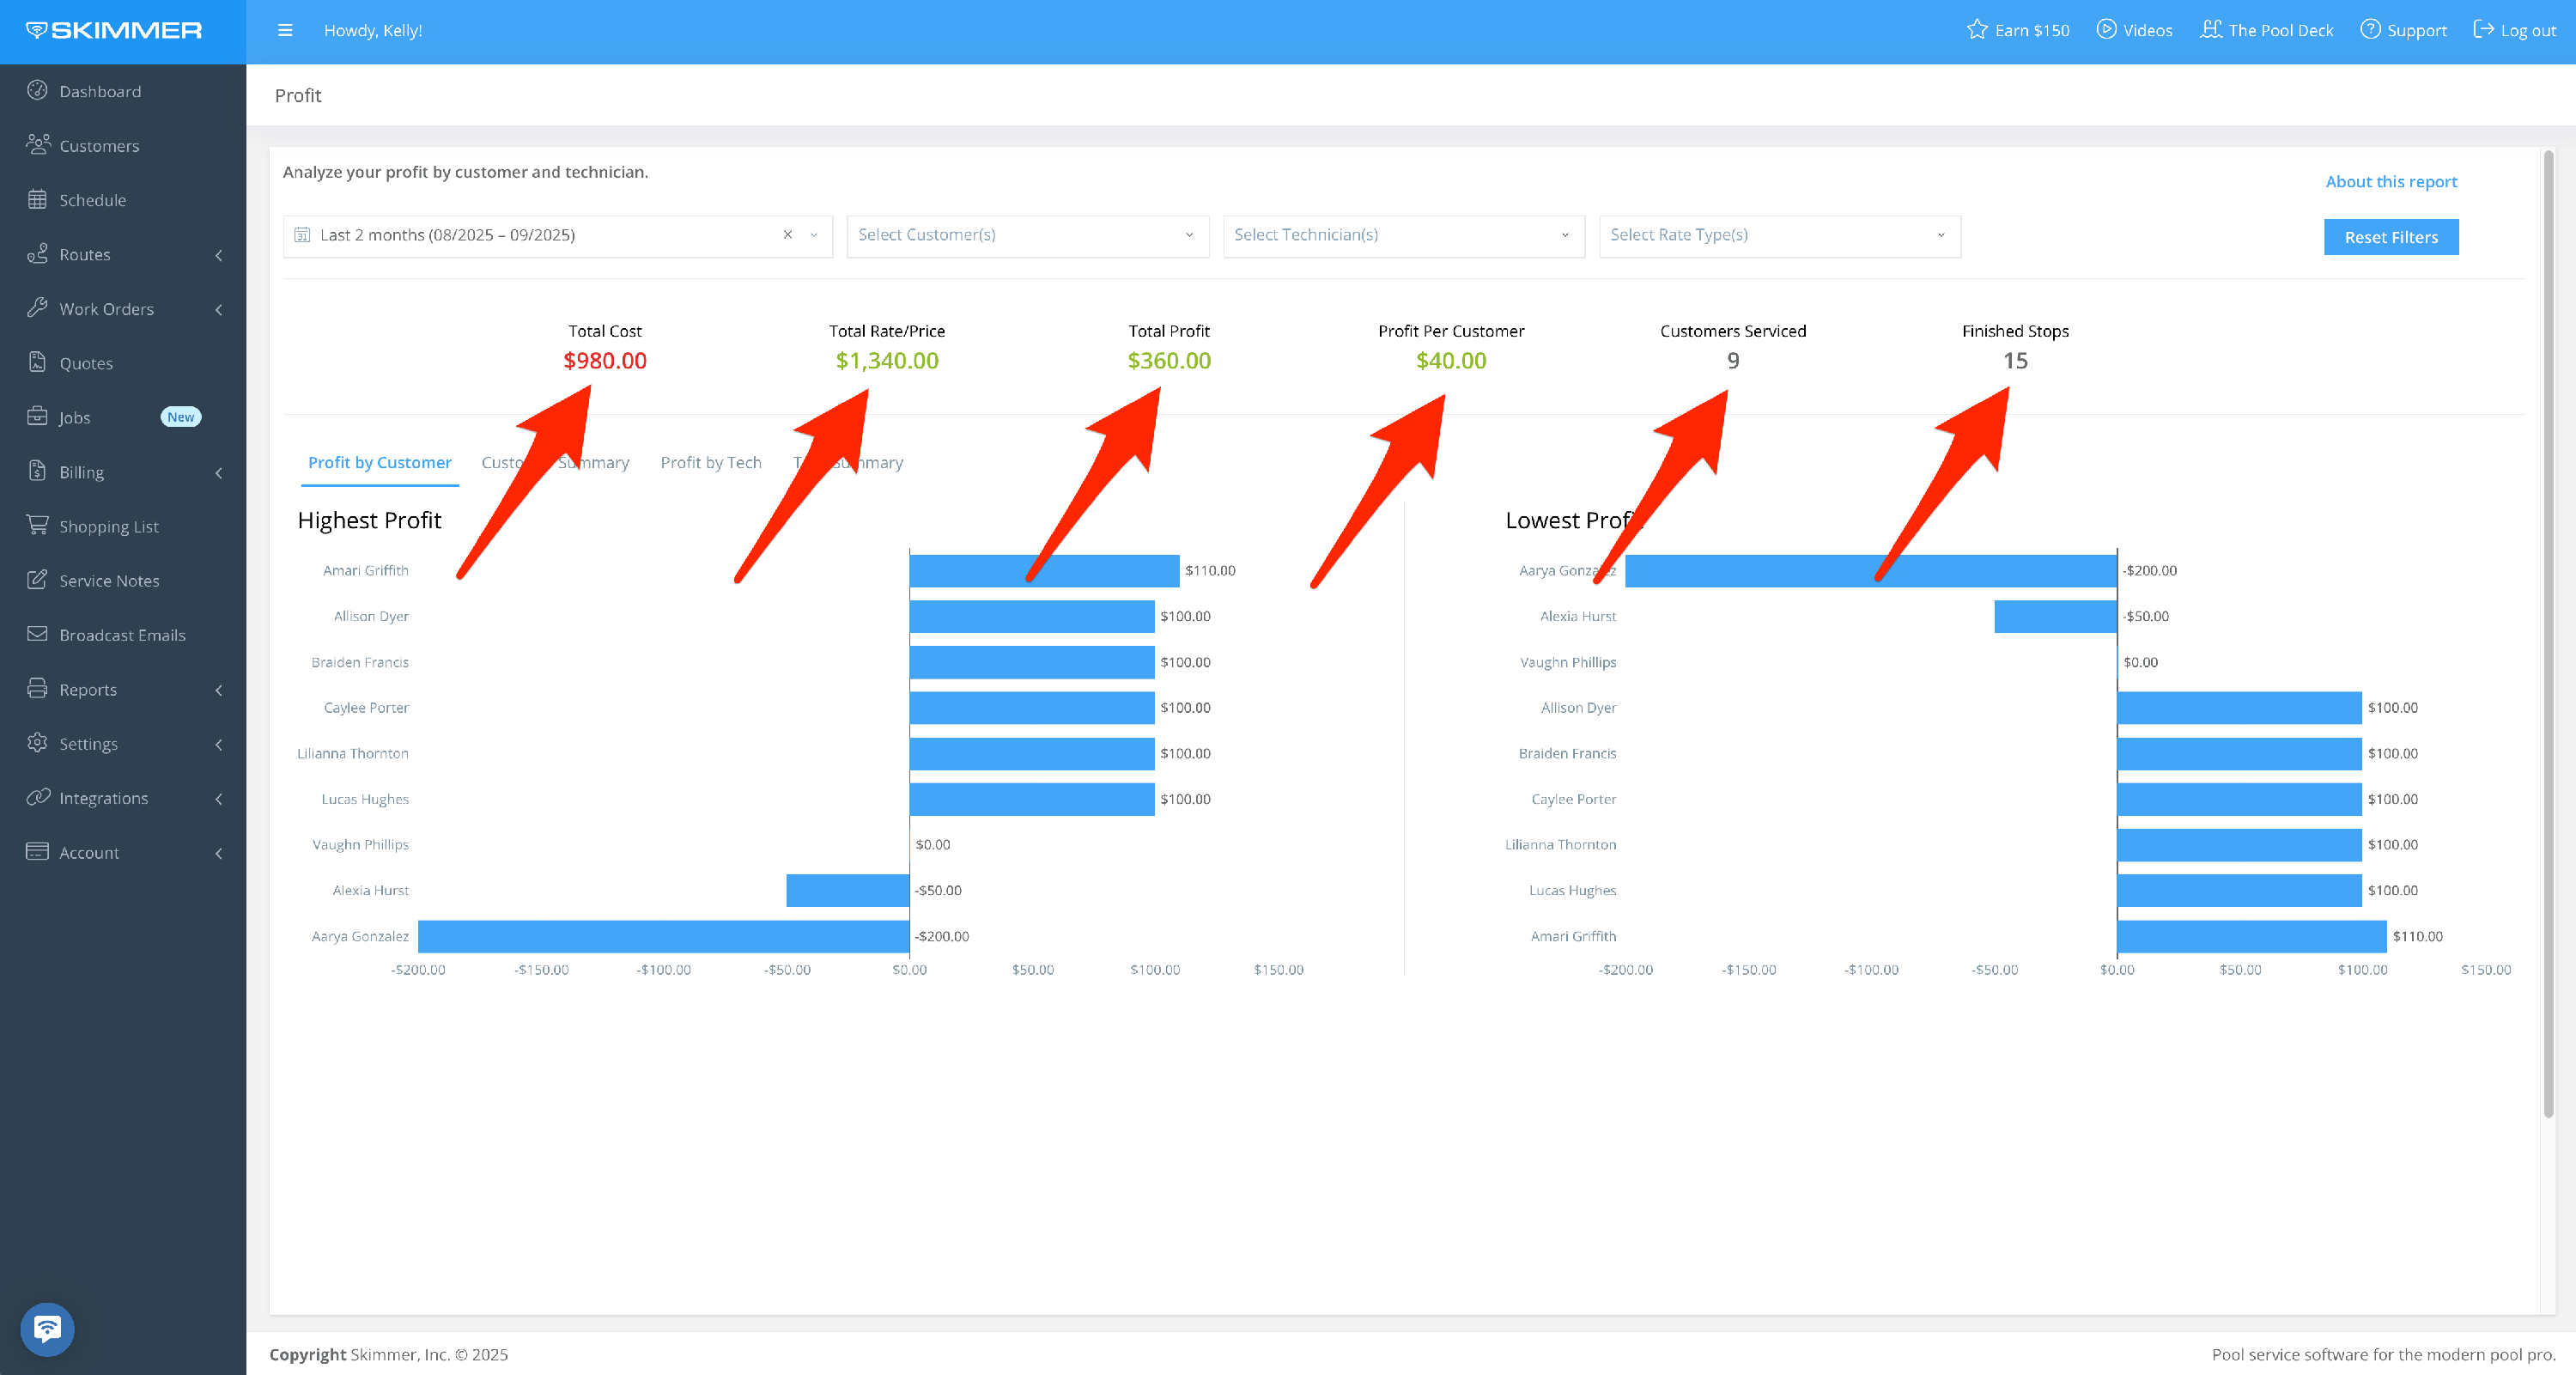
What you choose for filters will reflect in the following areas:
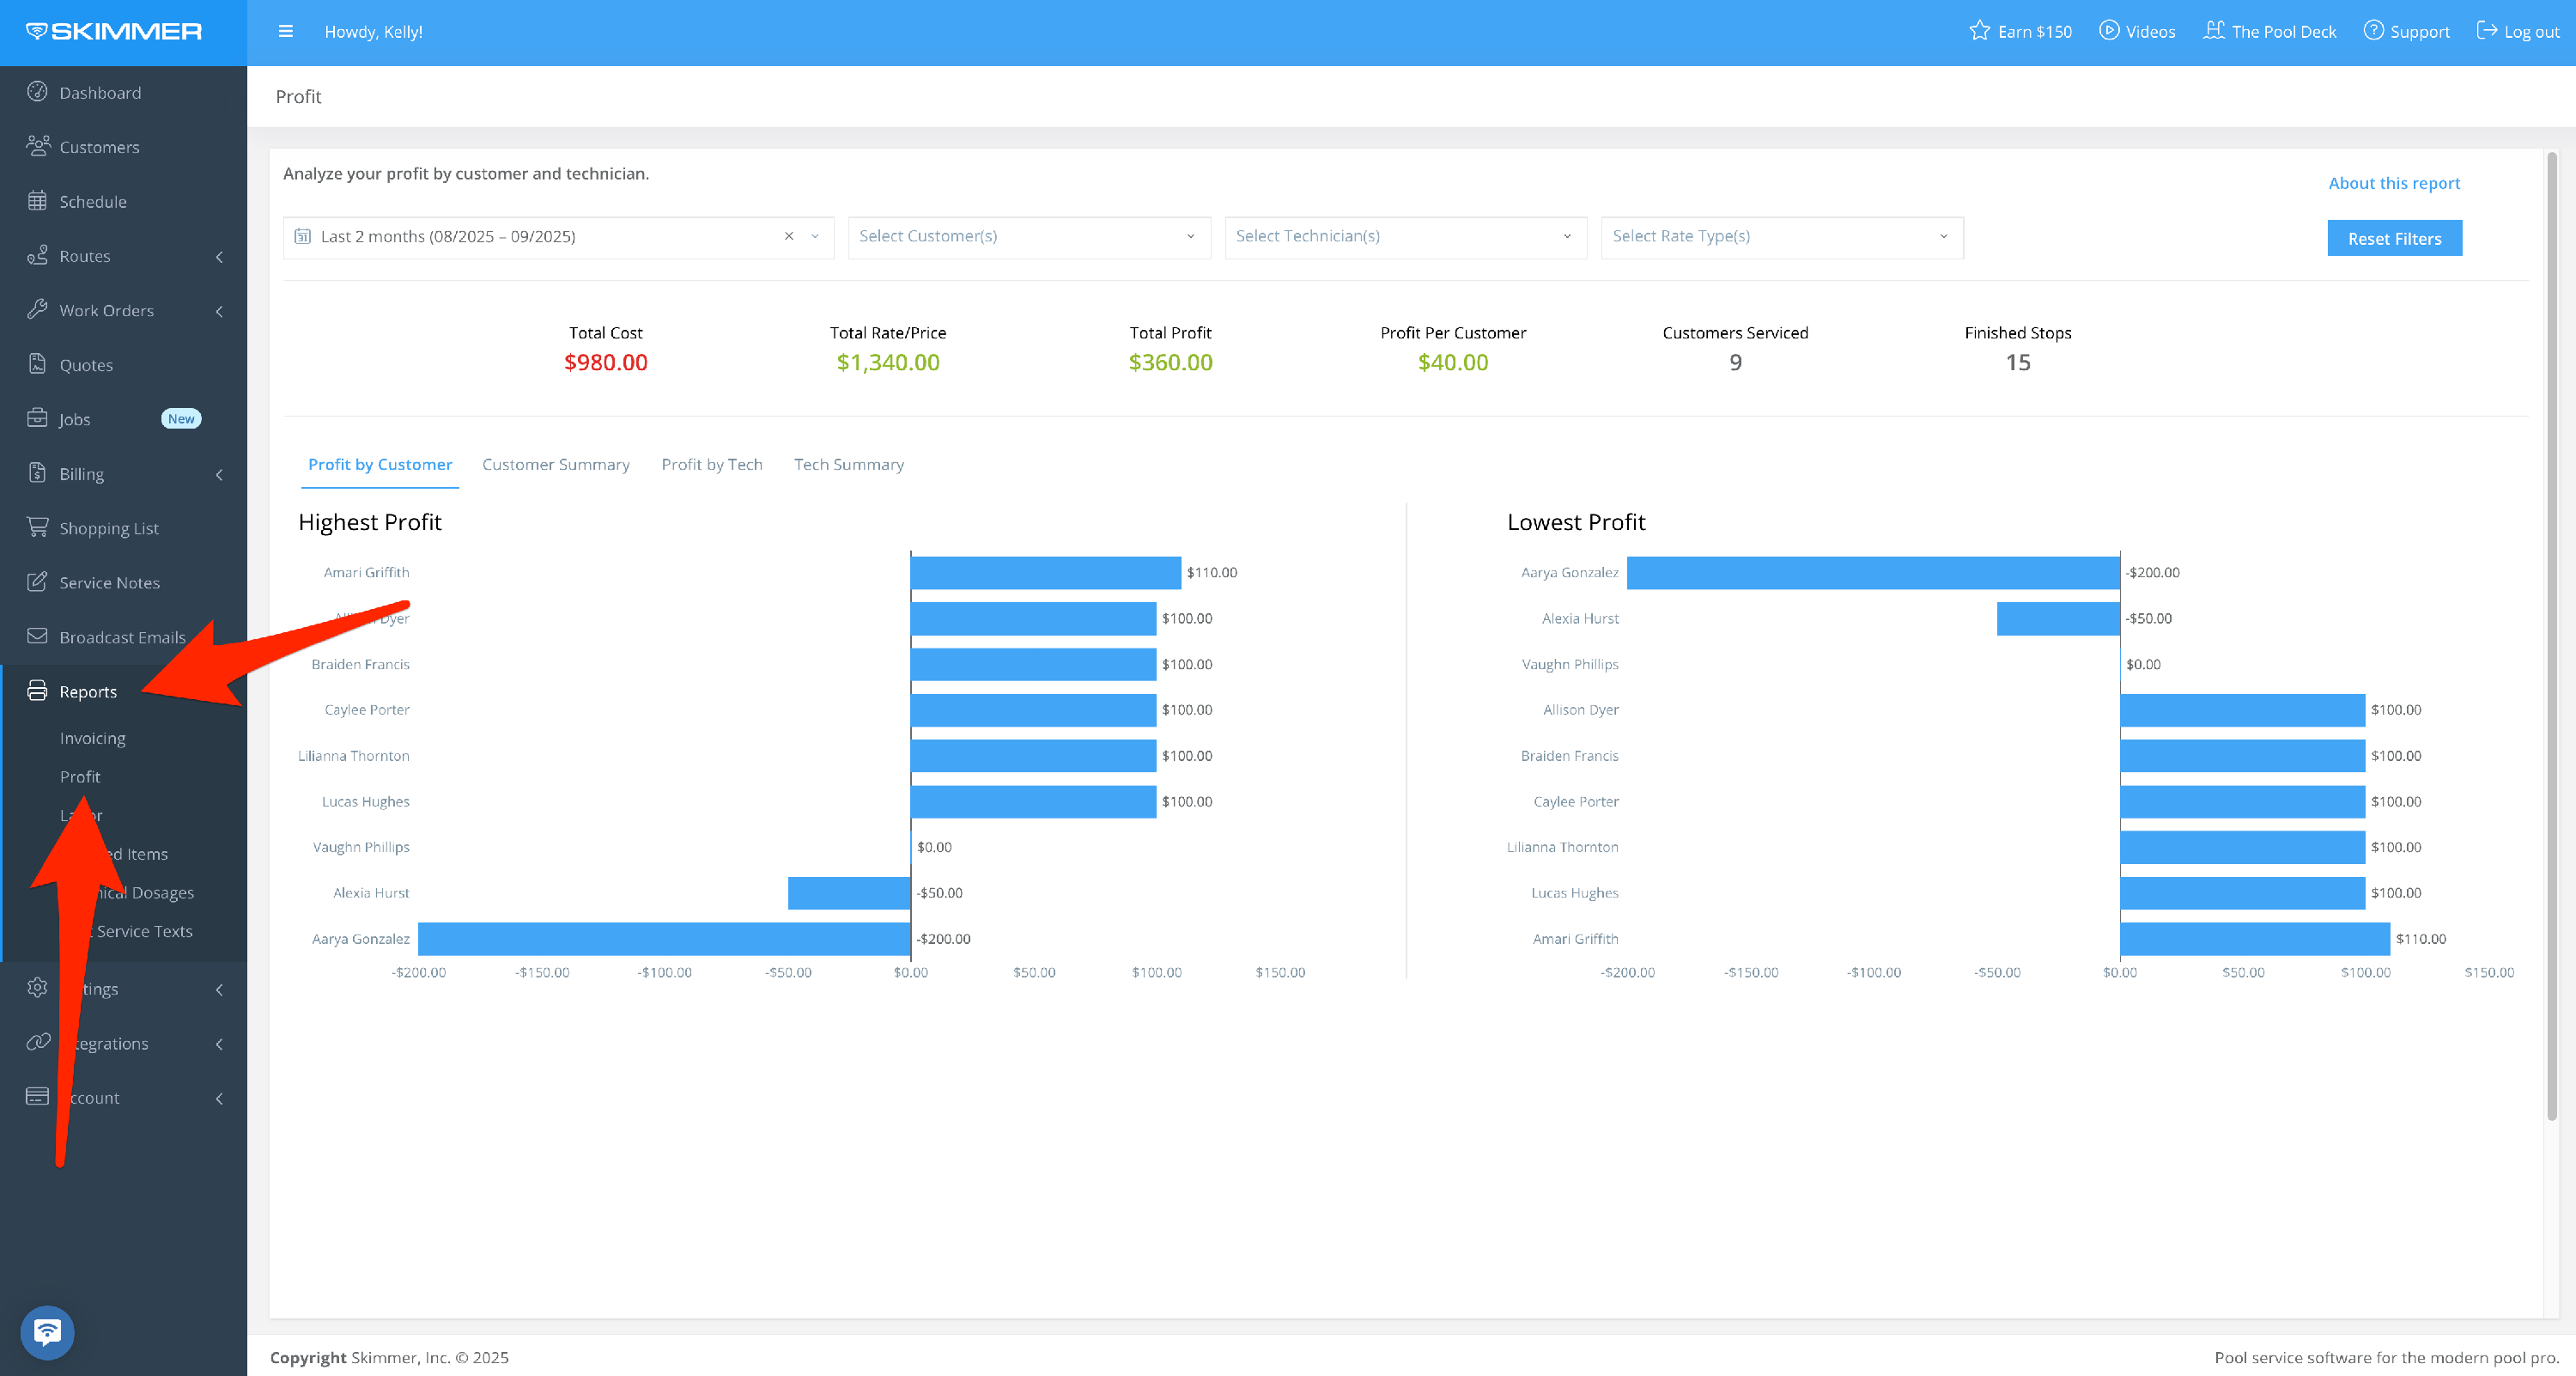
The first area gives you headline metrics, the overall cost of operation to you, total amount charged to customers, overall profit, and average profit per customer. You can also see how many customers were serviced and how many stops were finished in your date range.
- 6
-
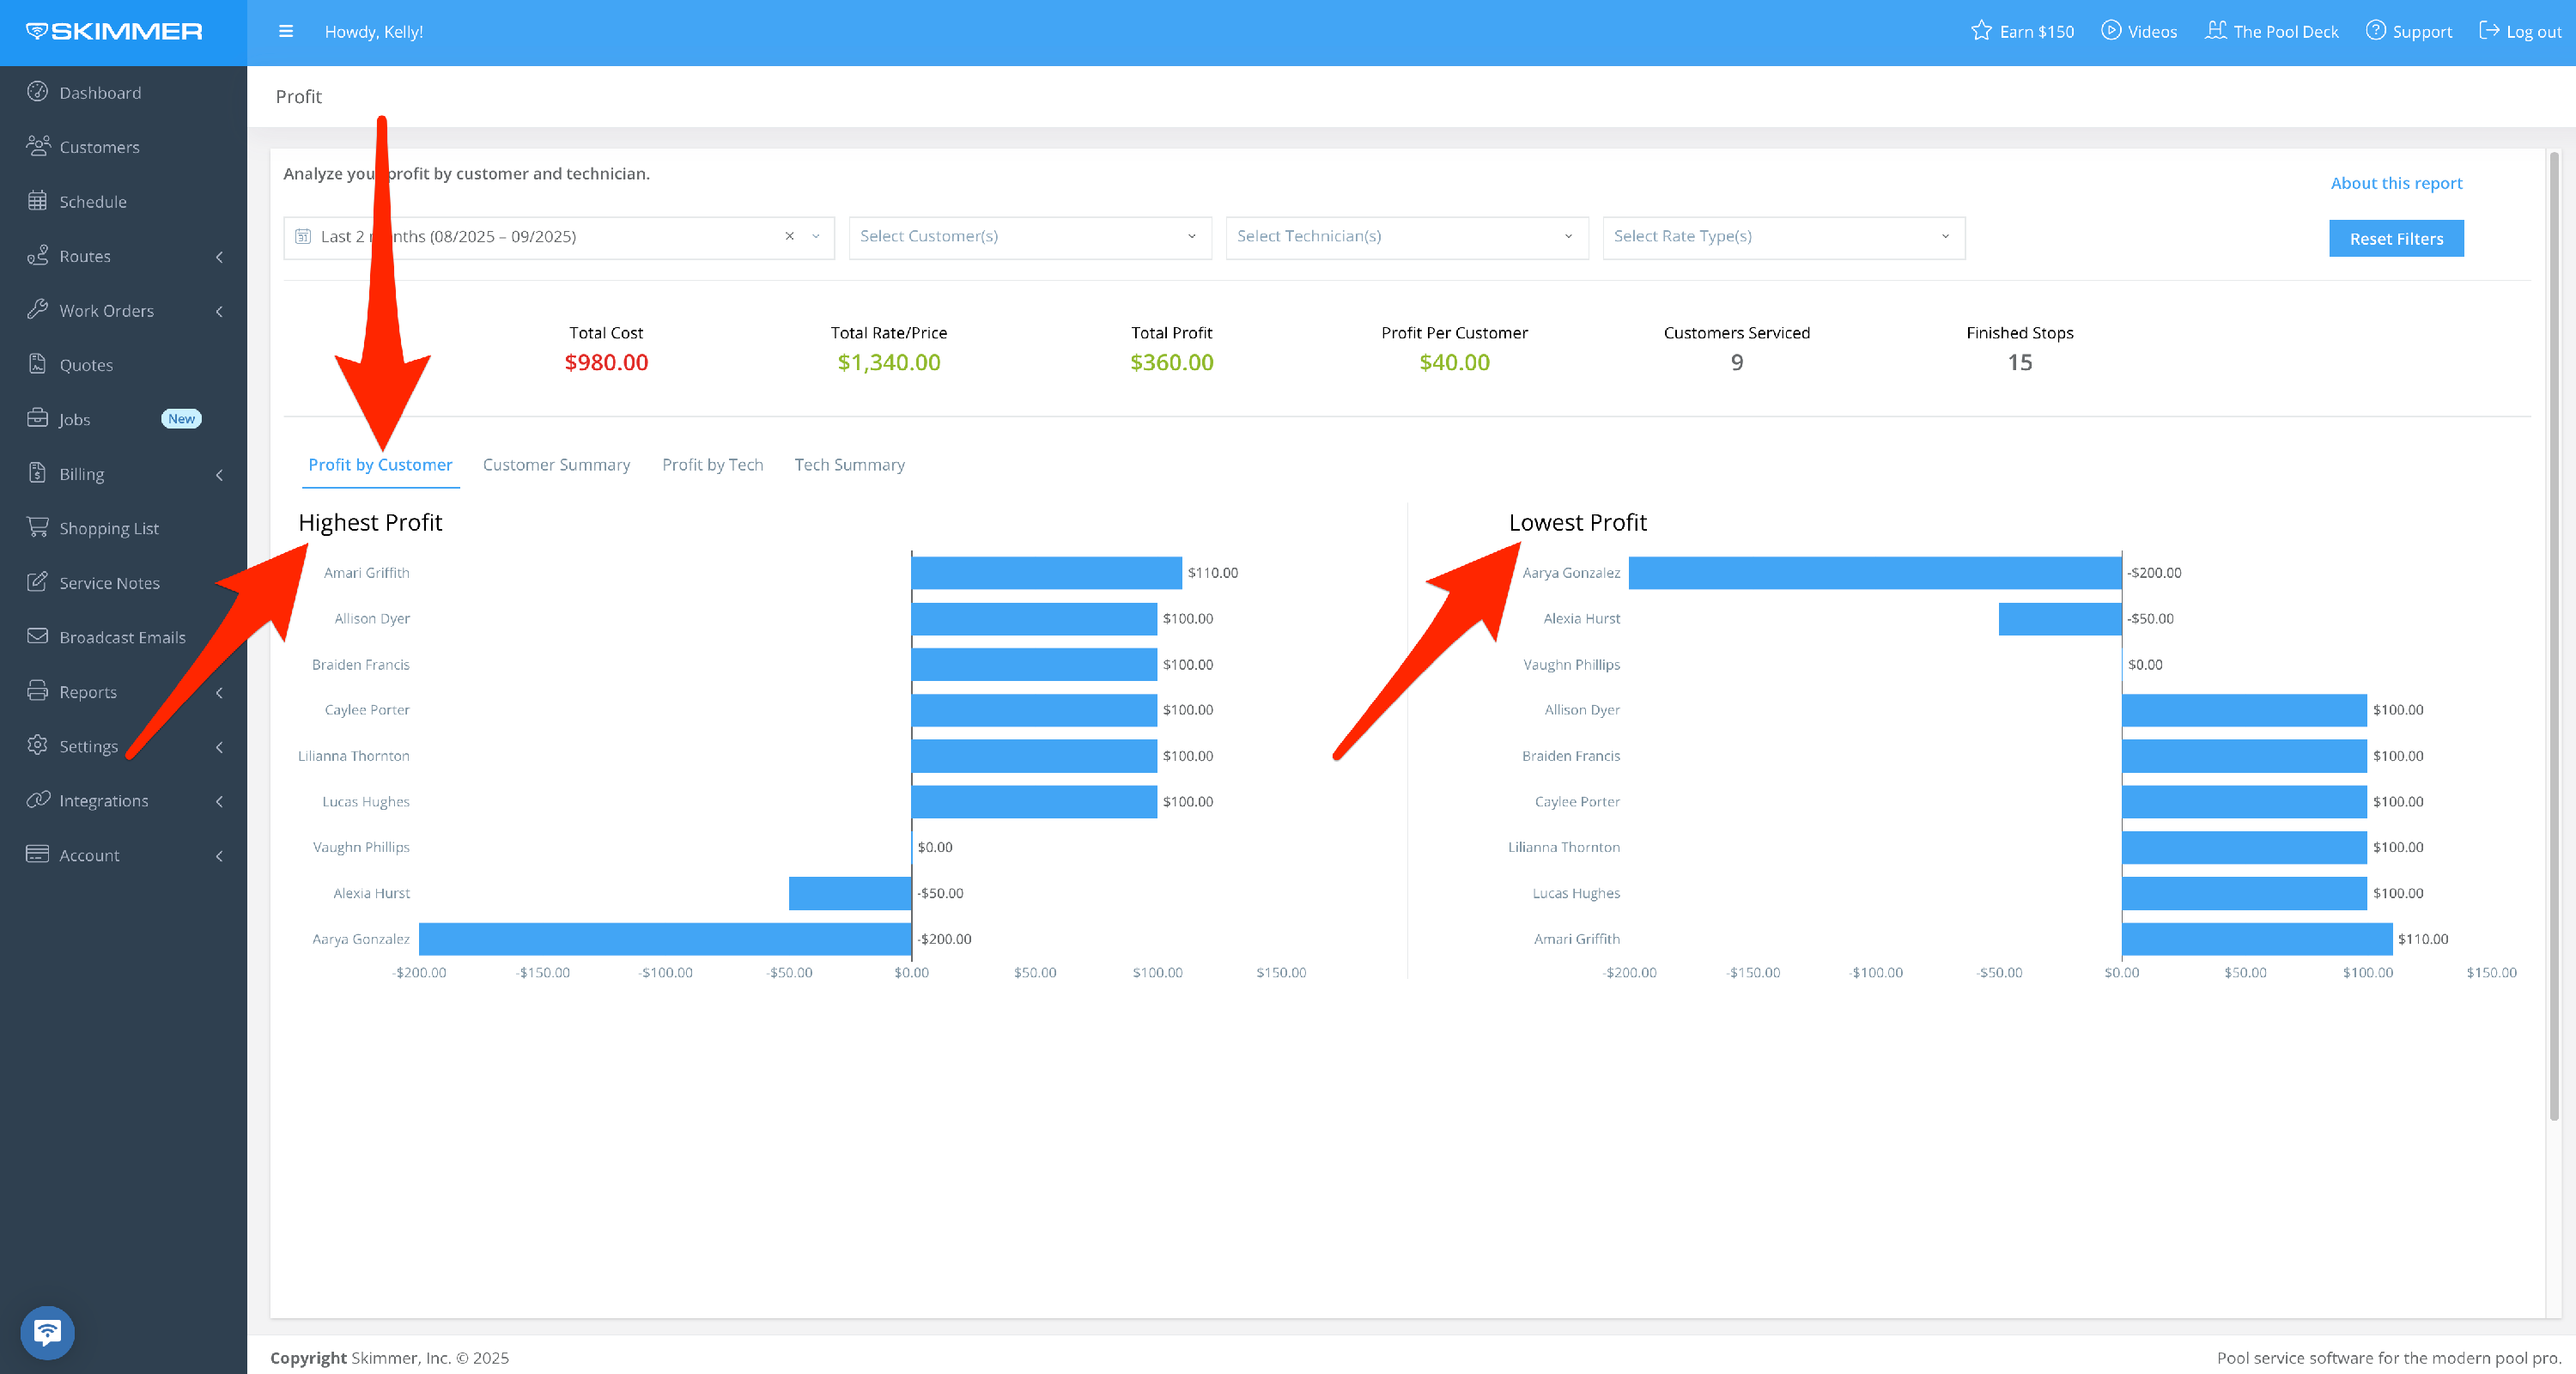
The second area gives you charts to help visualize the information.
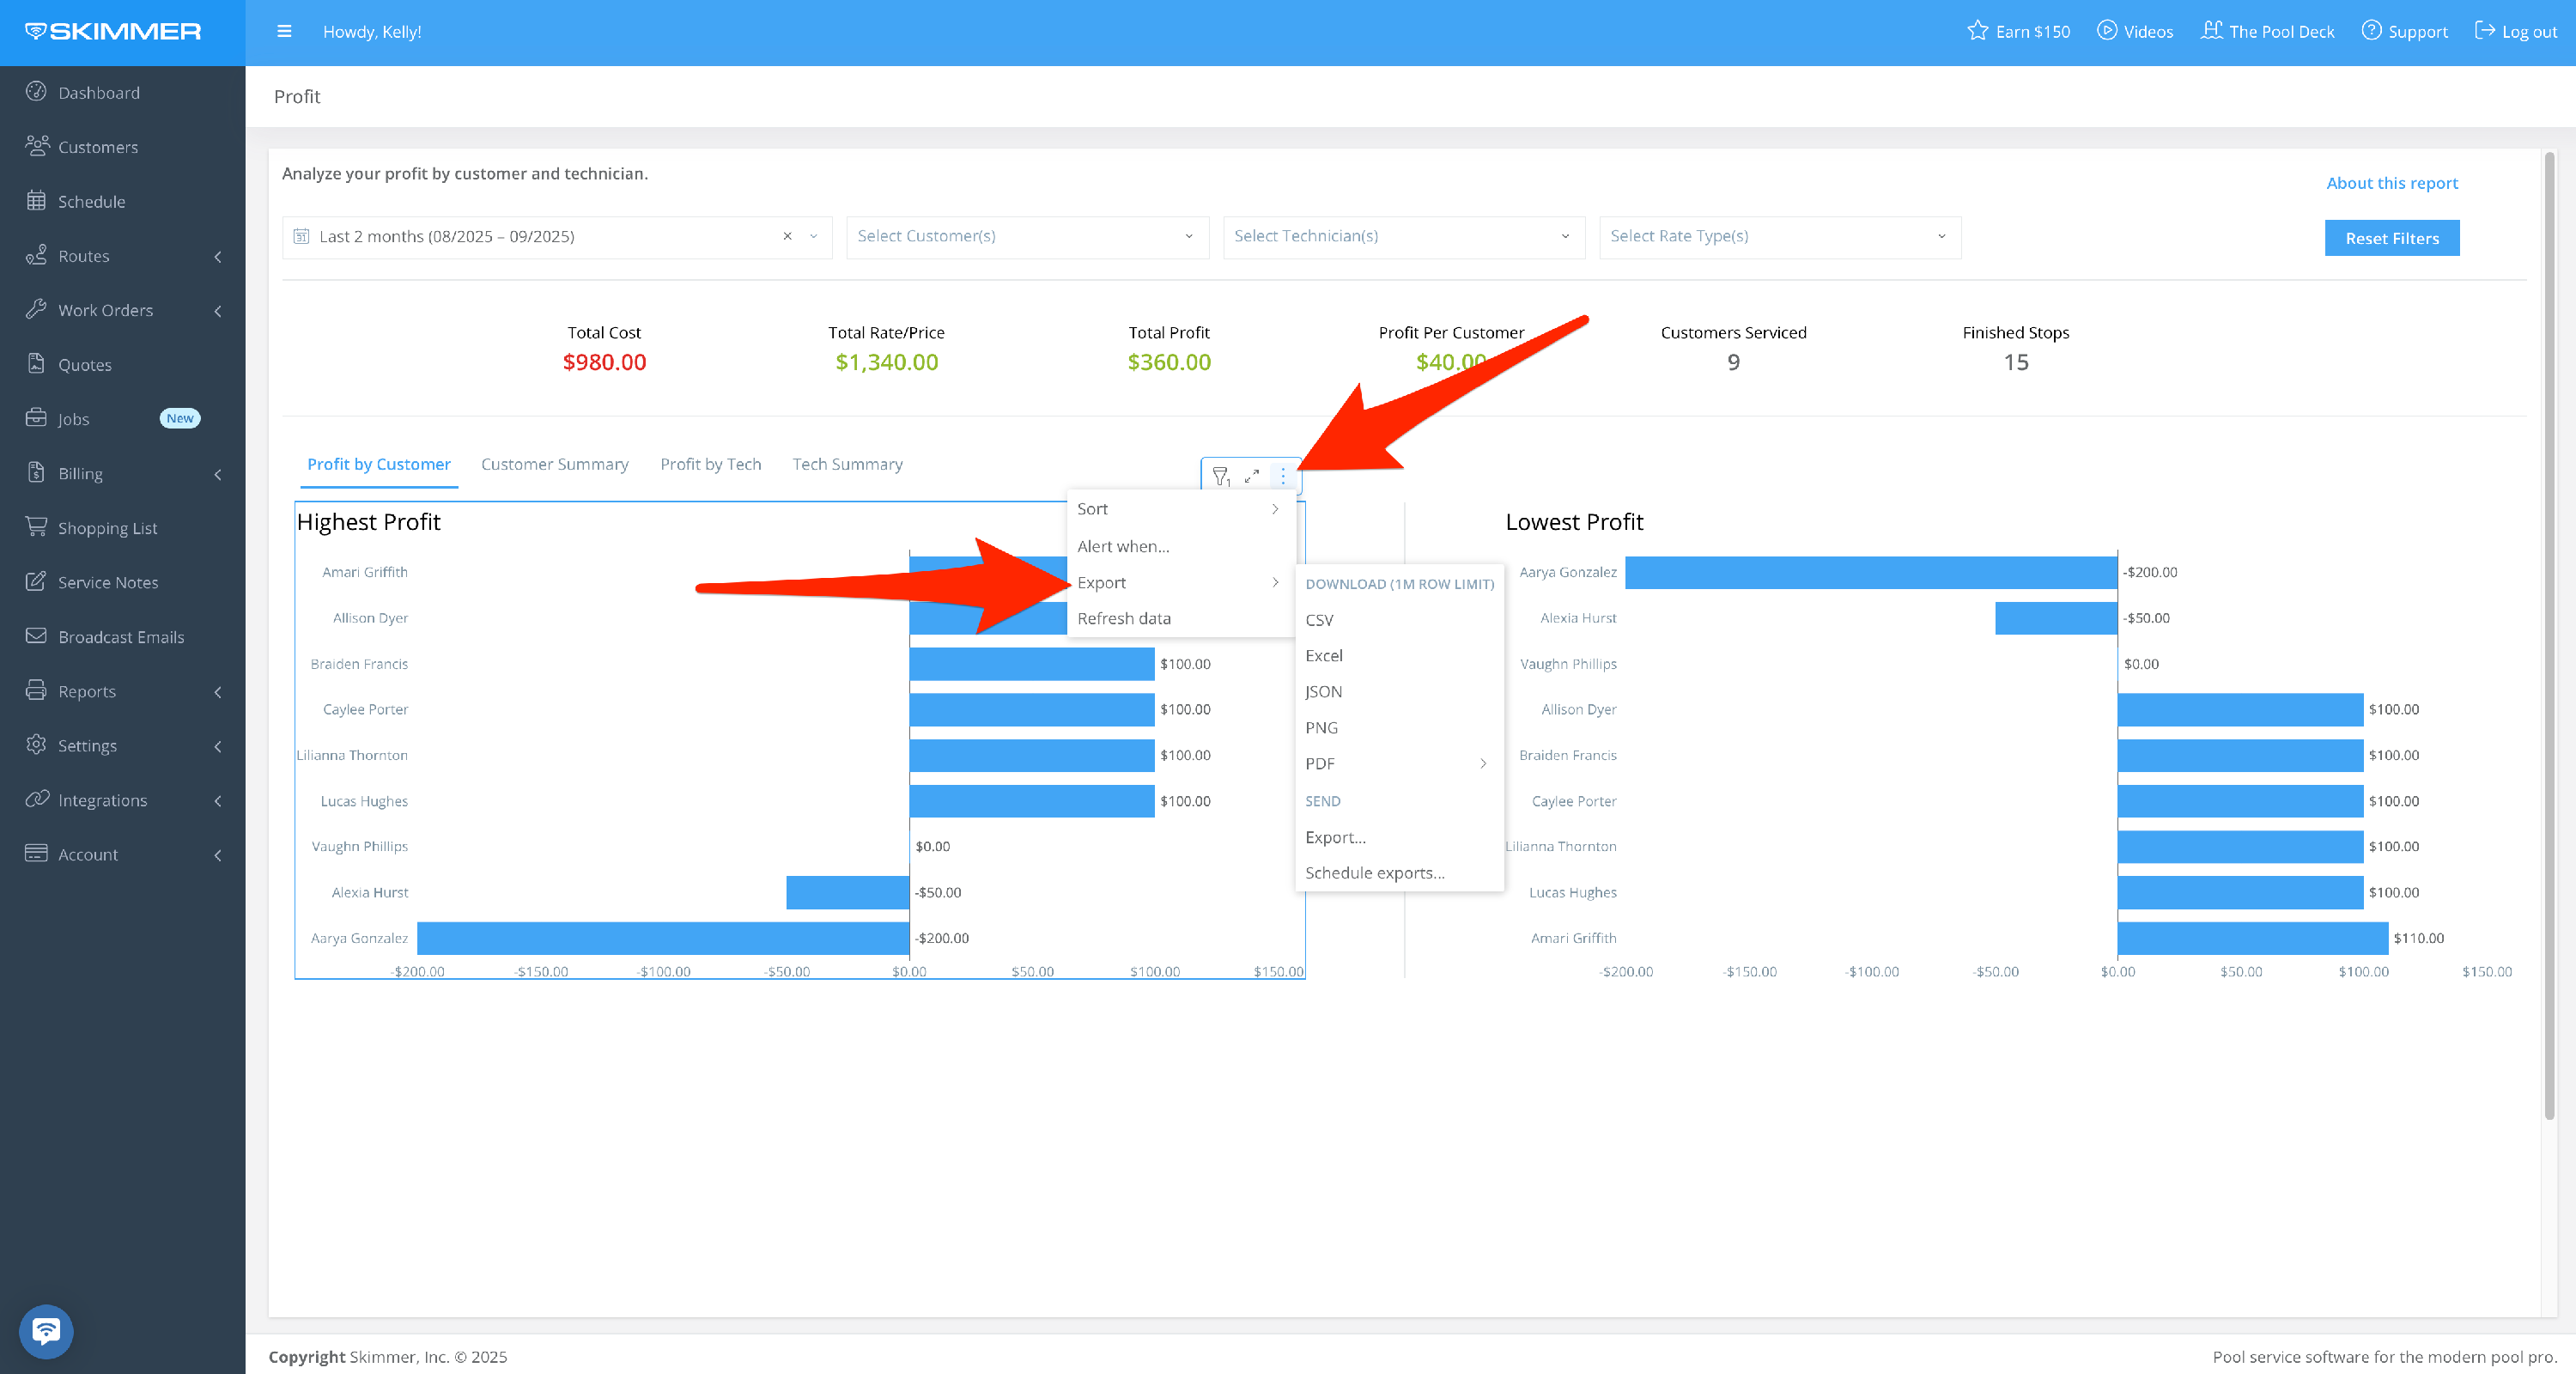
- Profit by Customer gives you two tables, one showing customers of highest profit, and one showing lowest.
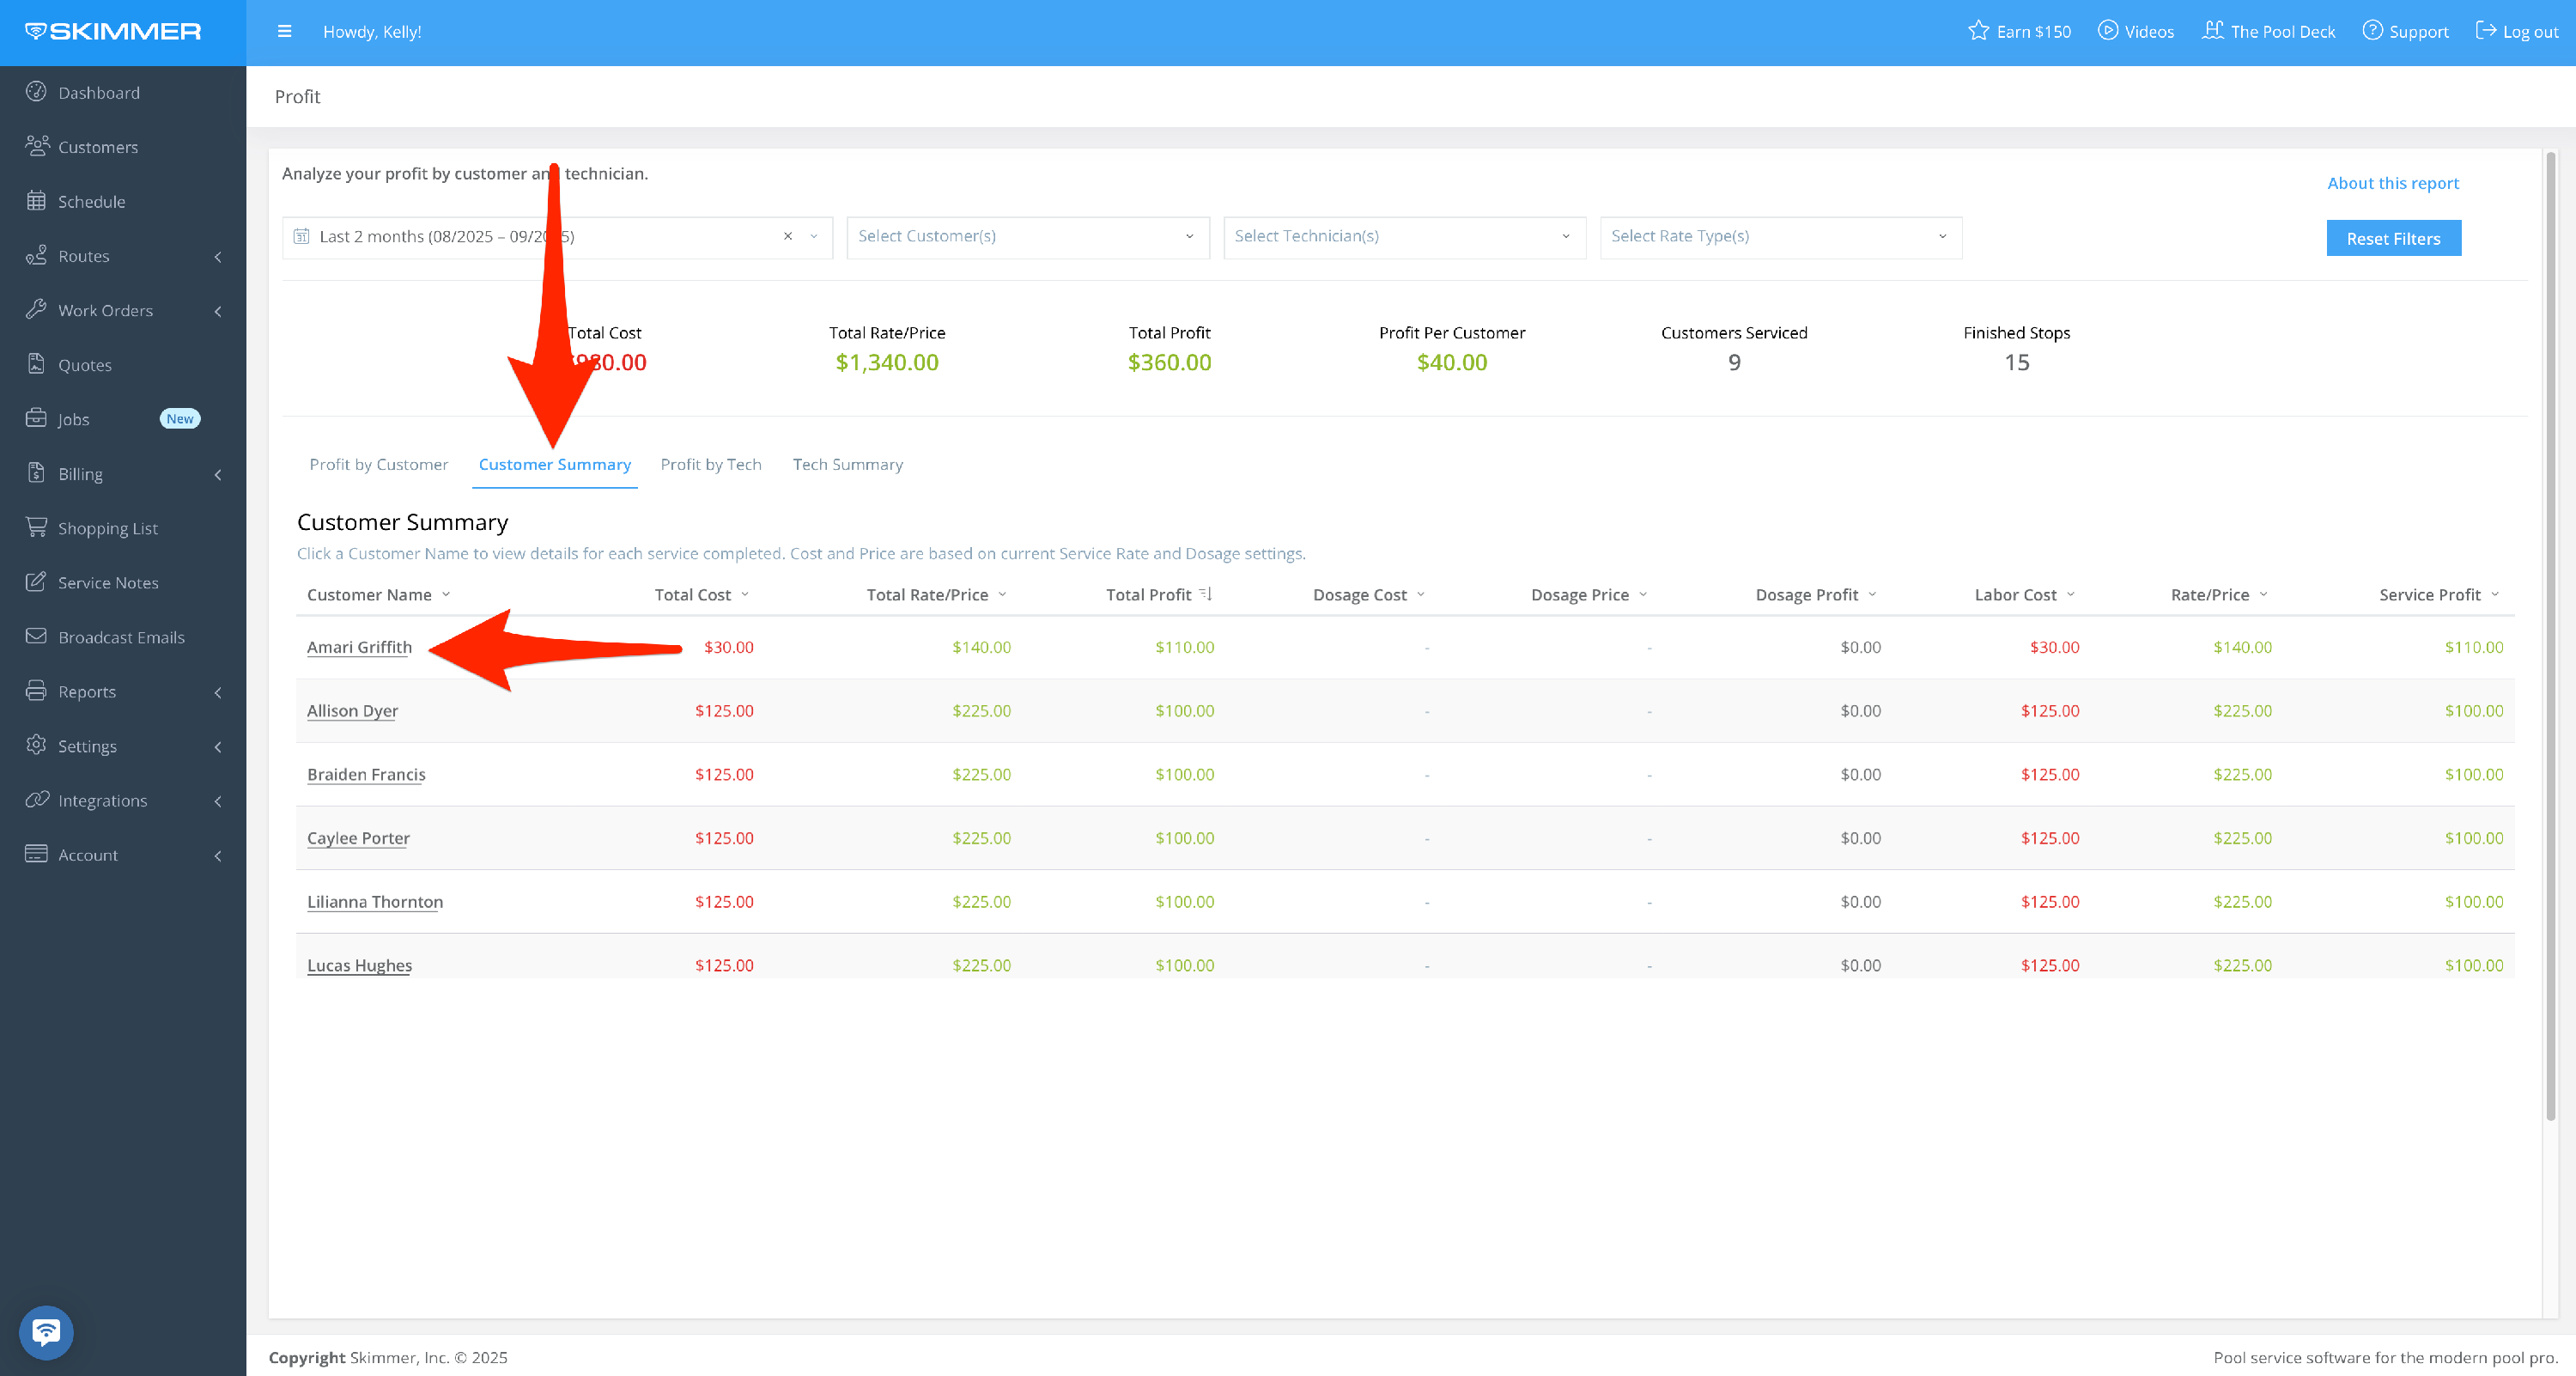
- Customer Summary gives full list of all customers serviced during your date range, along with a breakdown of cost vs price so you can see how you arrived at the profit for each customer. Total Cost is the sum of Dosage Cost and Labor Cost, and so on. Note that if you’re including work orders, the Rate column will display the work order price.
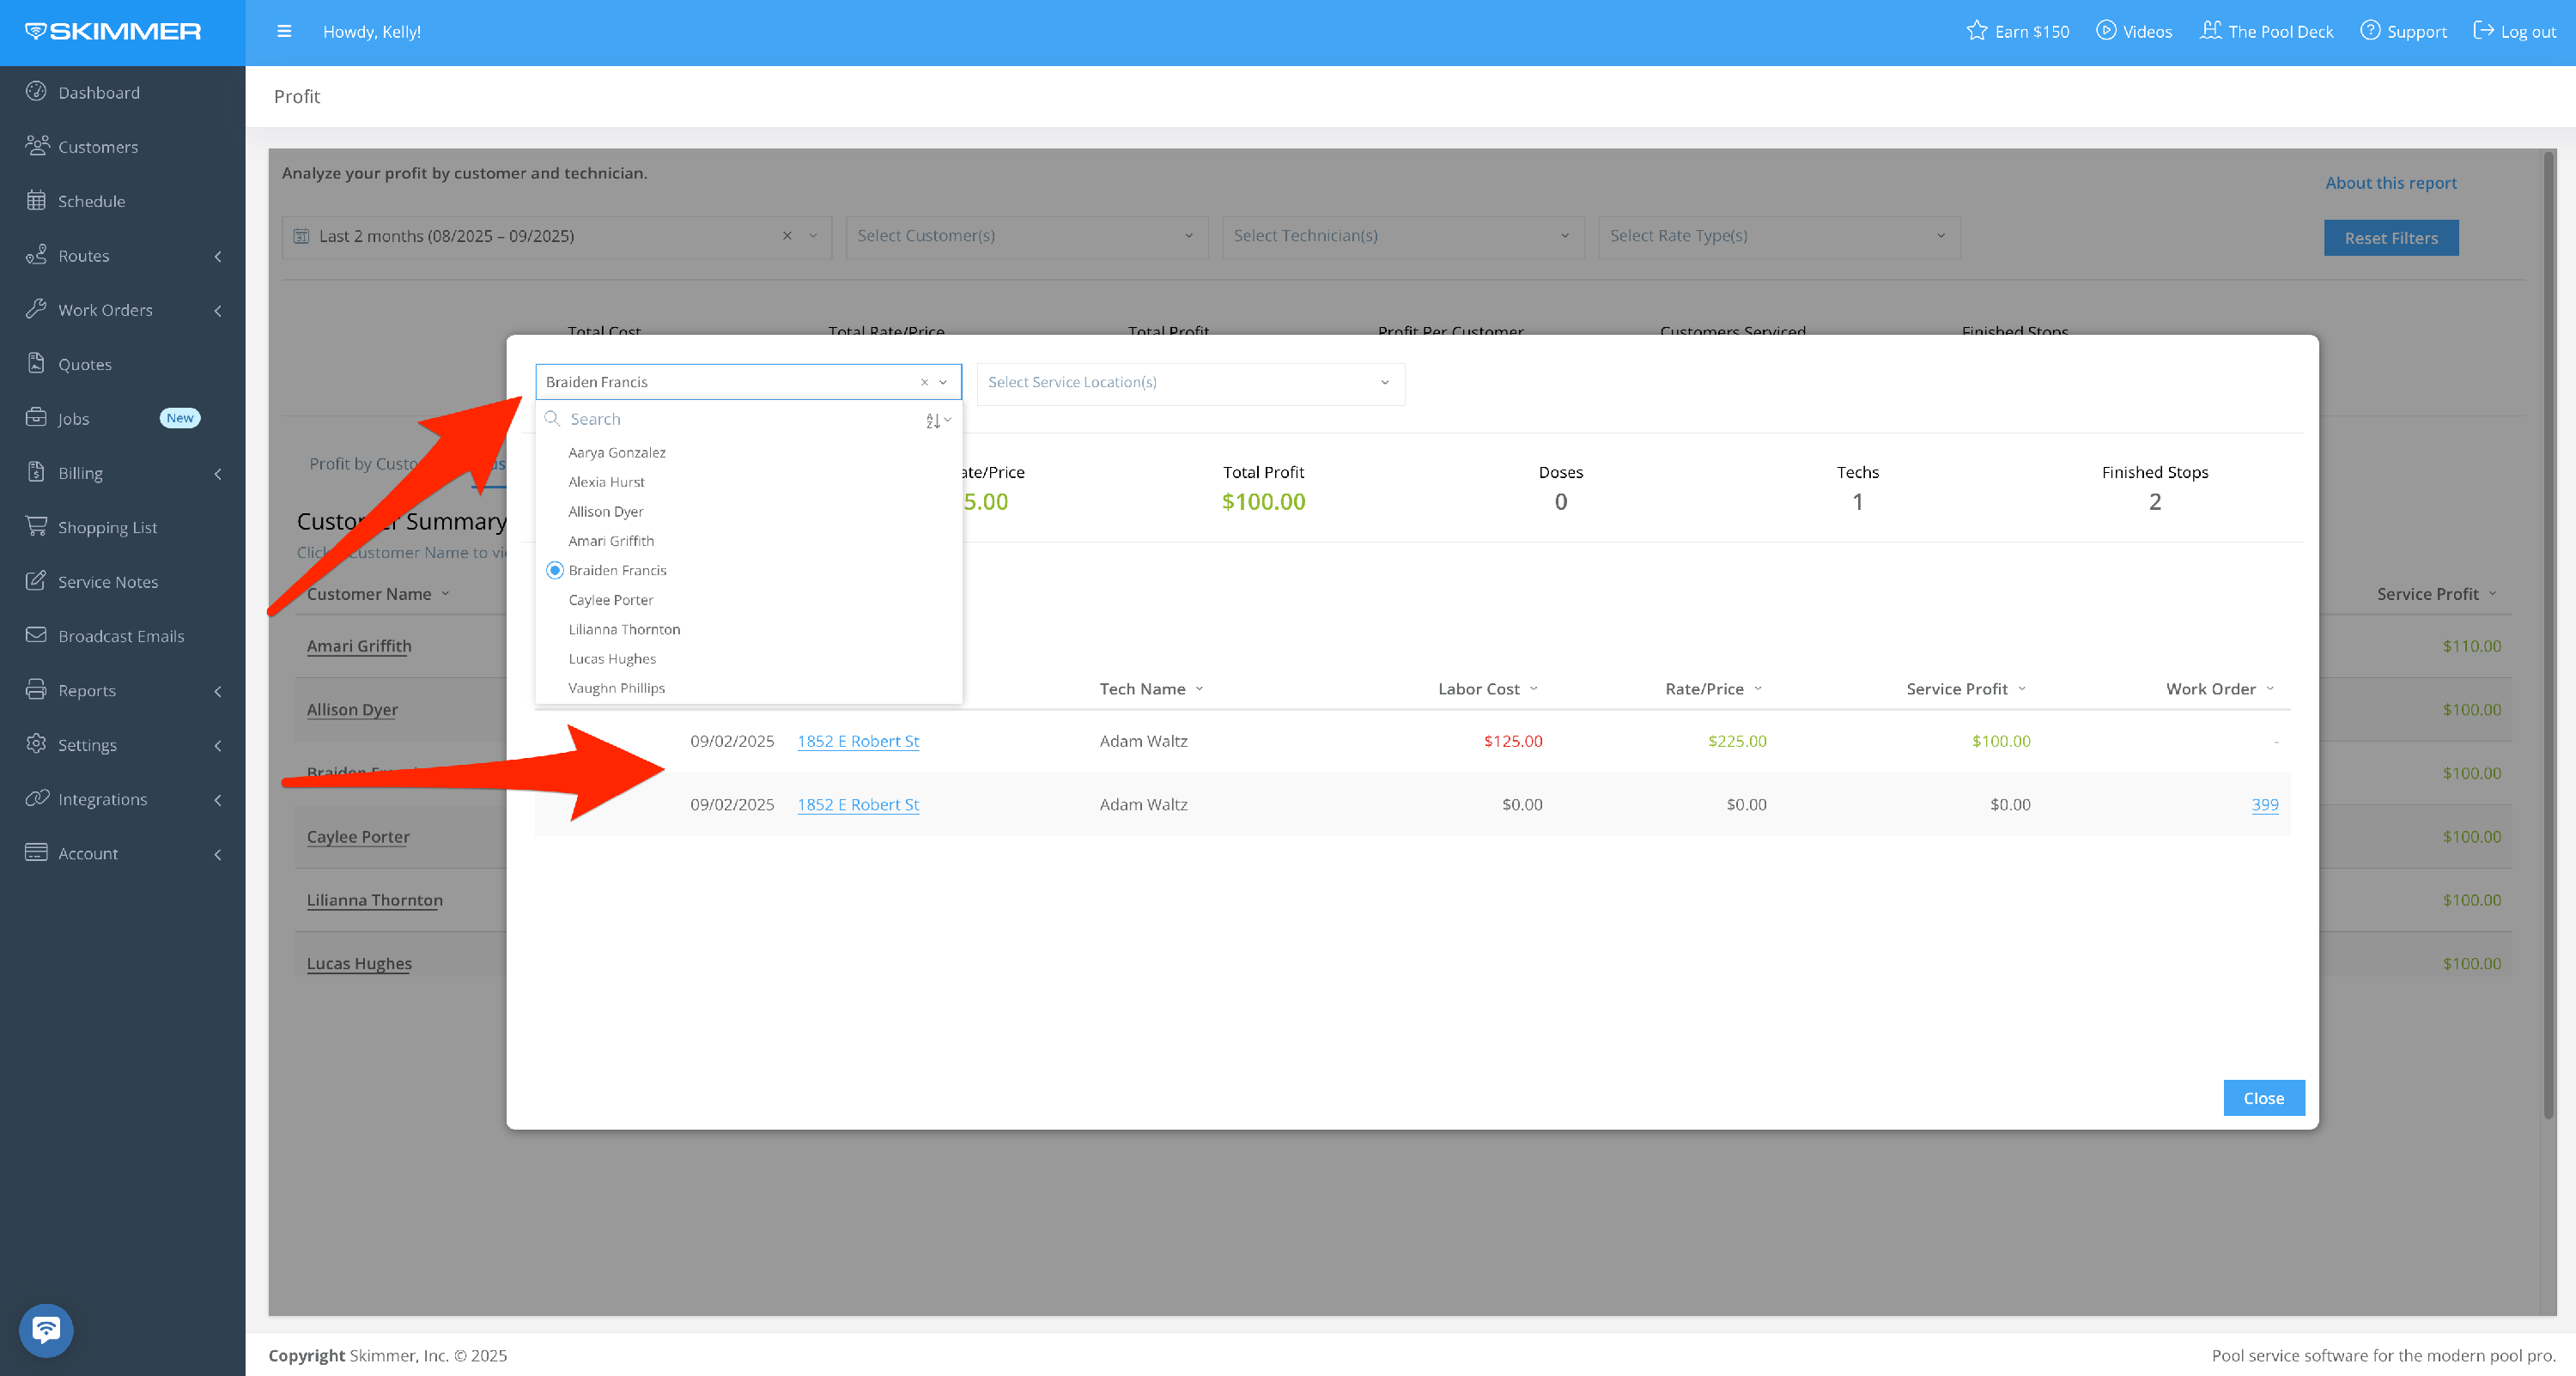
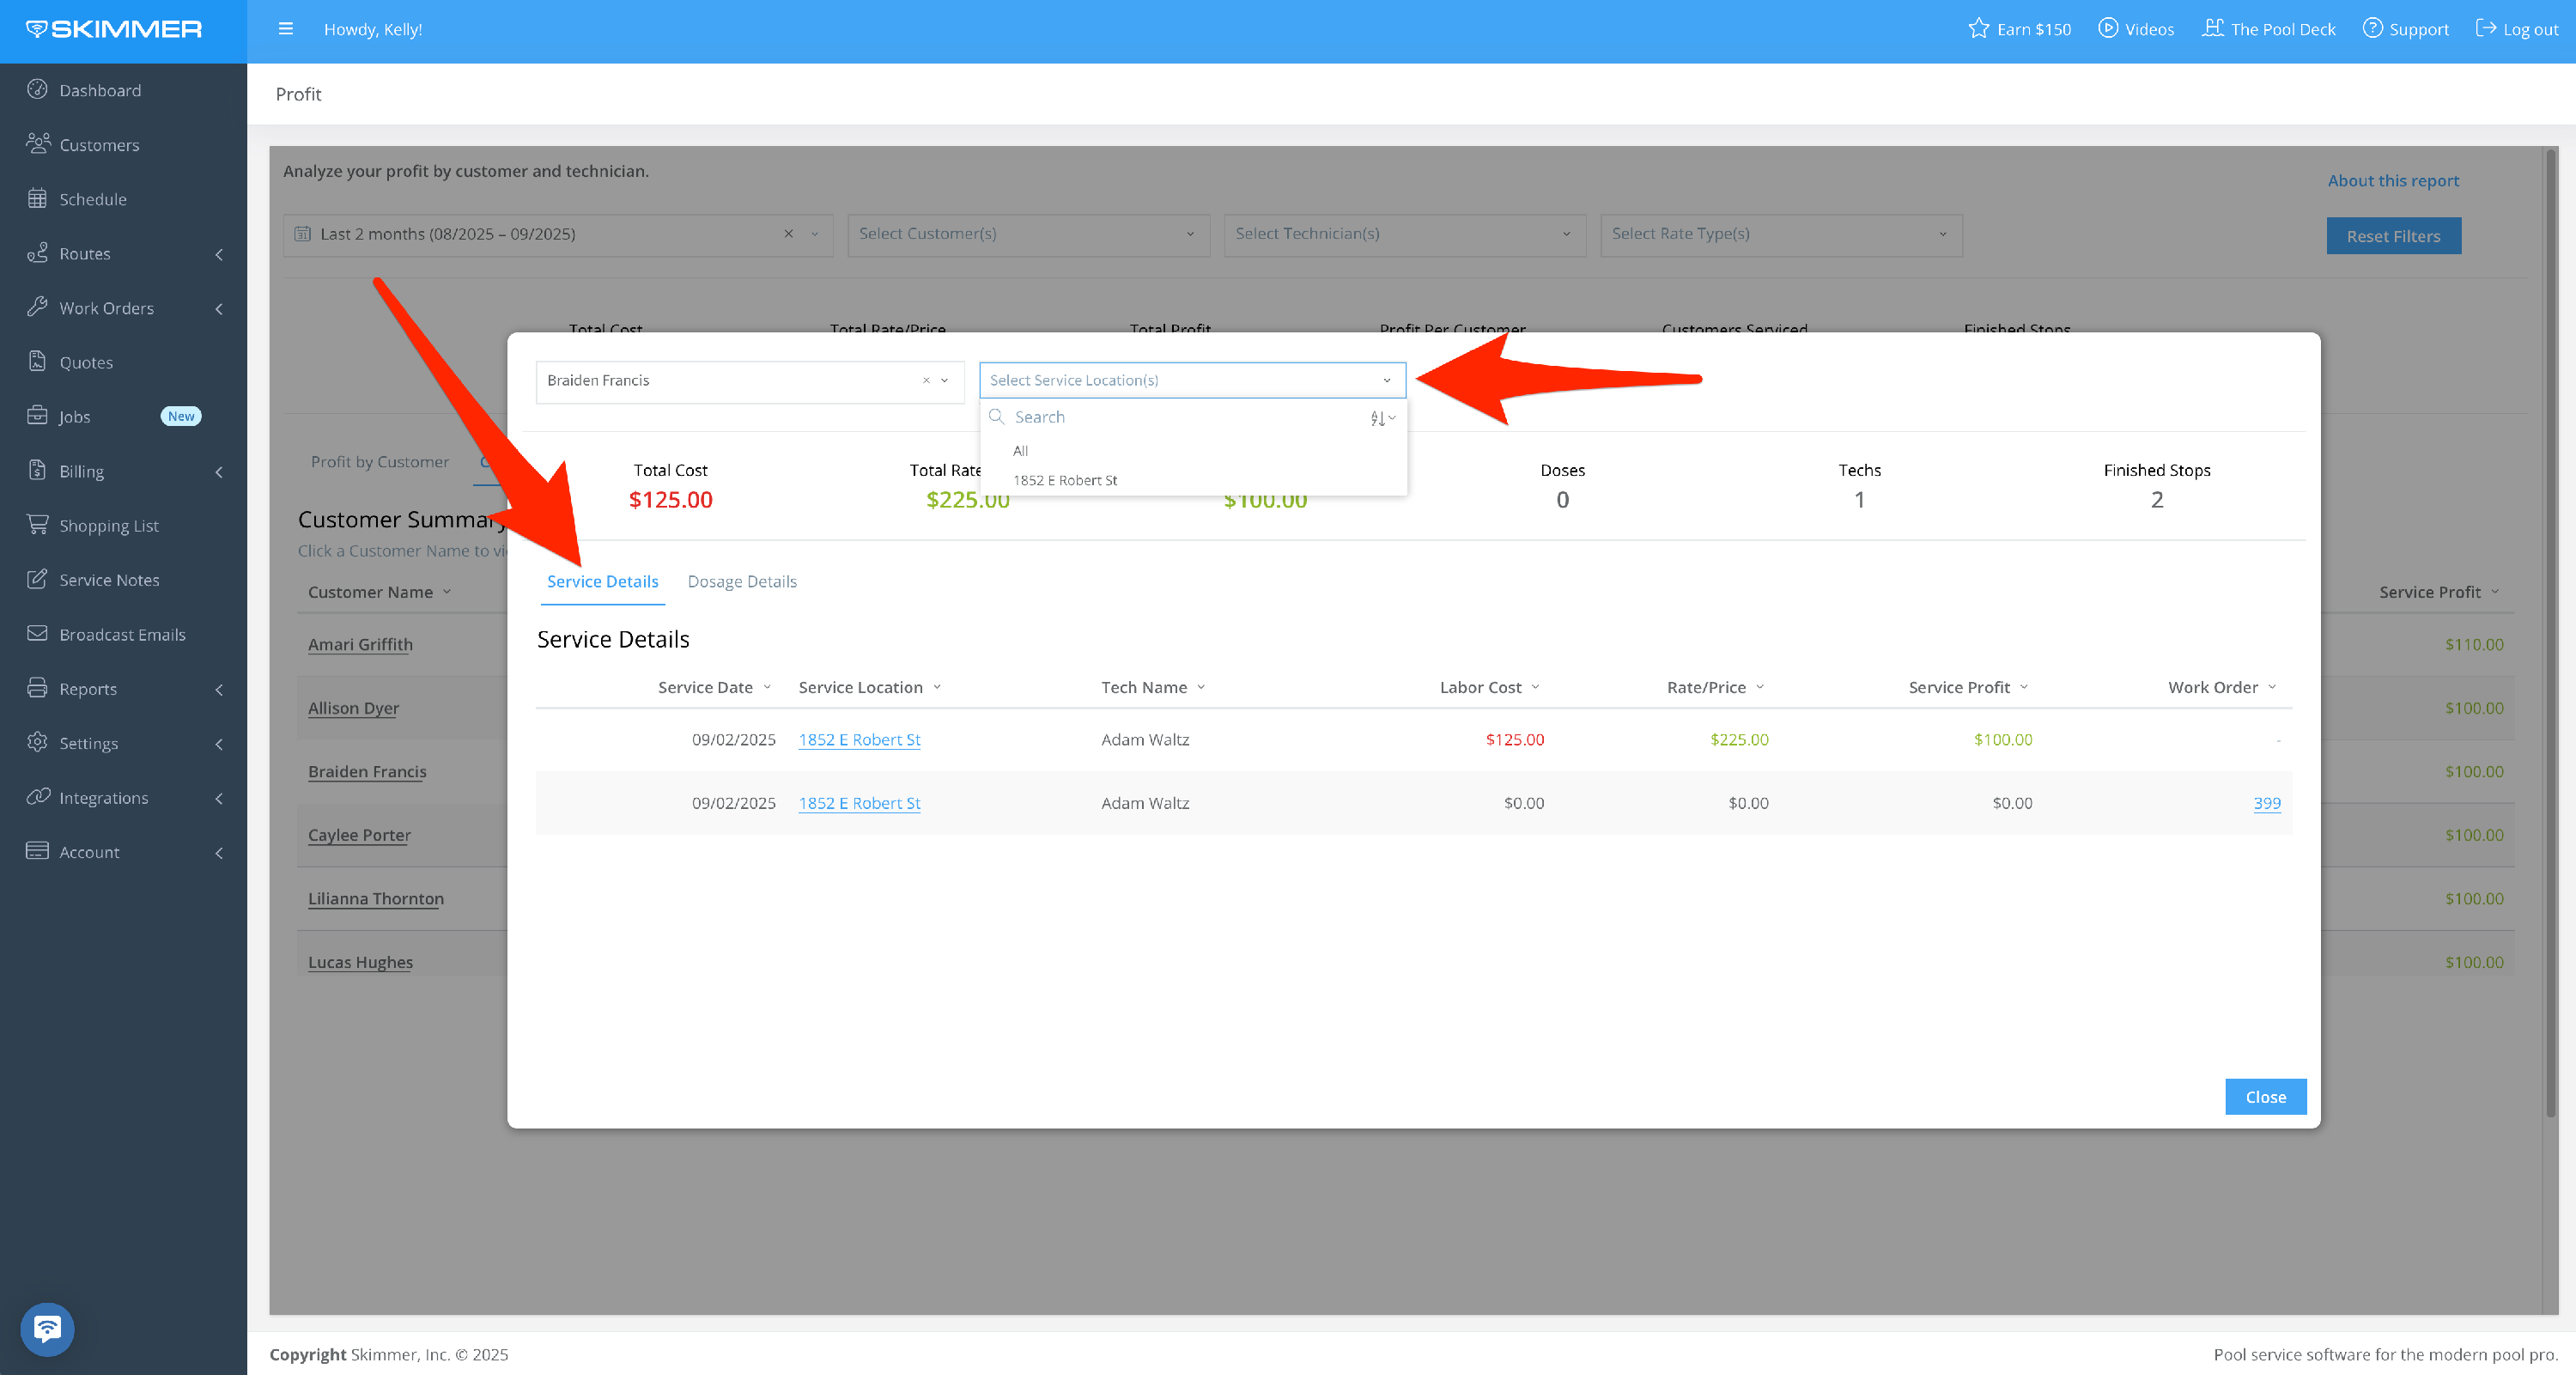
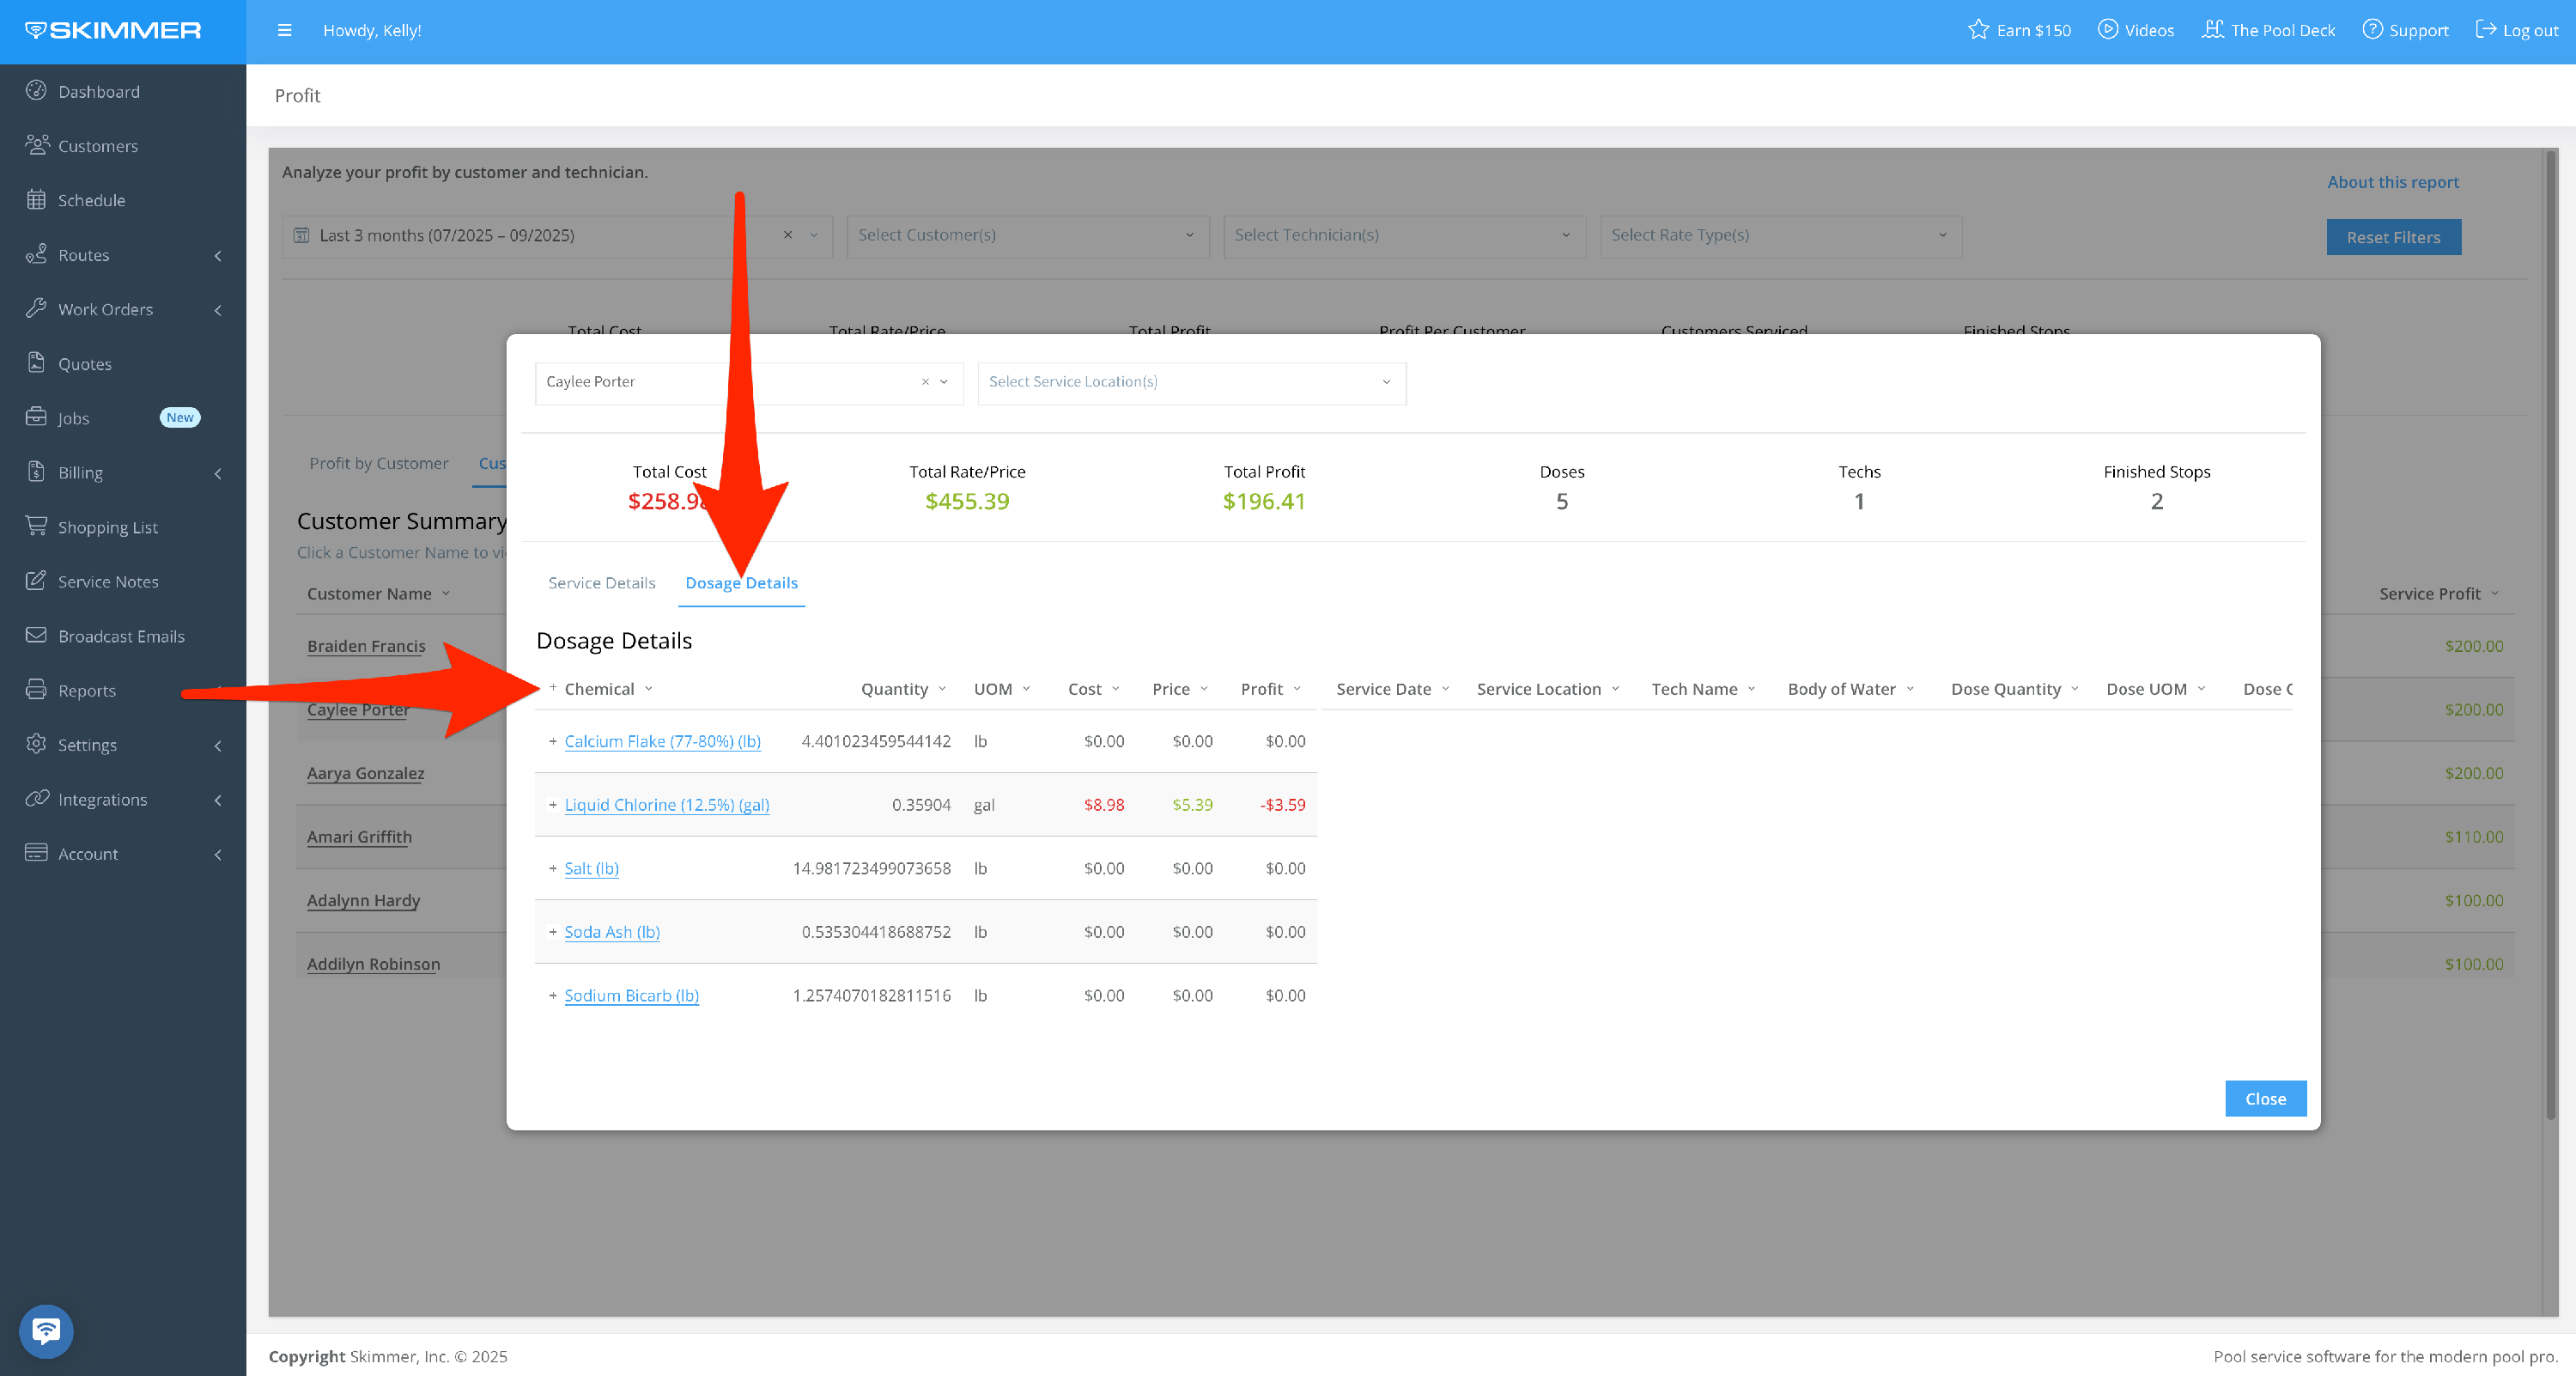
- For more information, click on a customer’s name and the pop-up screen will show this data for each service location. If they have multiple service locations, you can view them all or filter down to a selection. You can also use the Customer dropdown to switch between customers without having to exit this view. The Service Details tab shows labor cost, rate, profit, and related service information. Dosage Details will display individual dosage values and related cost, rate, profit, and service information.
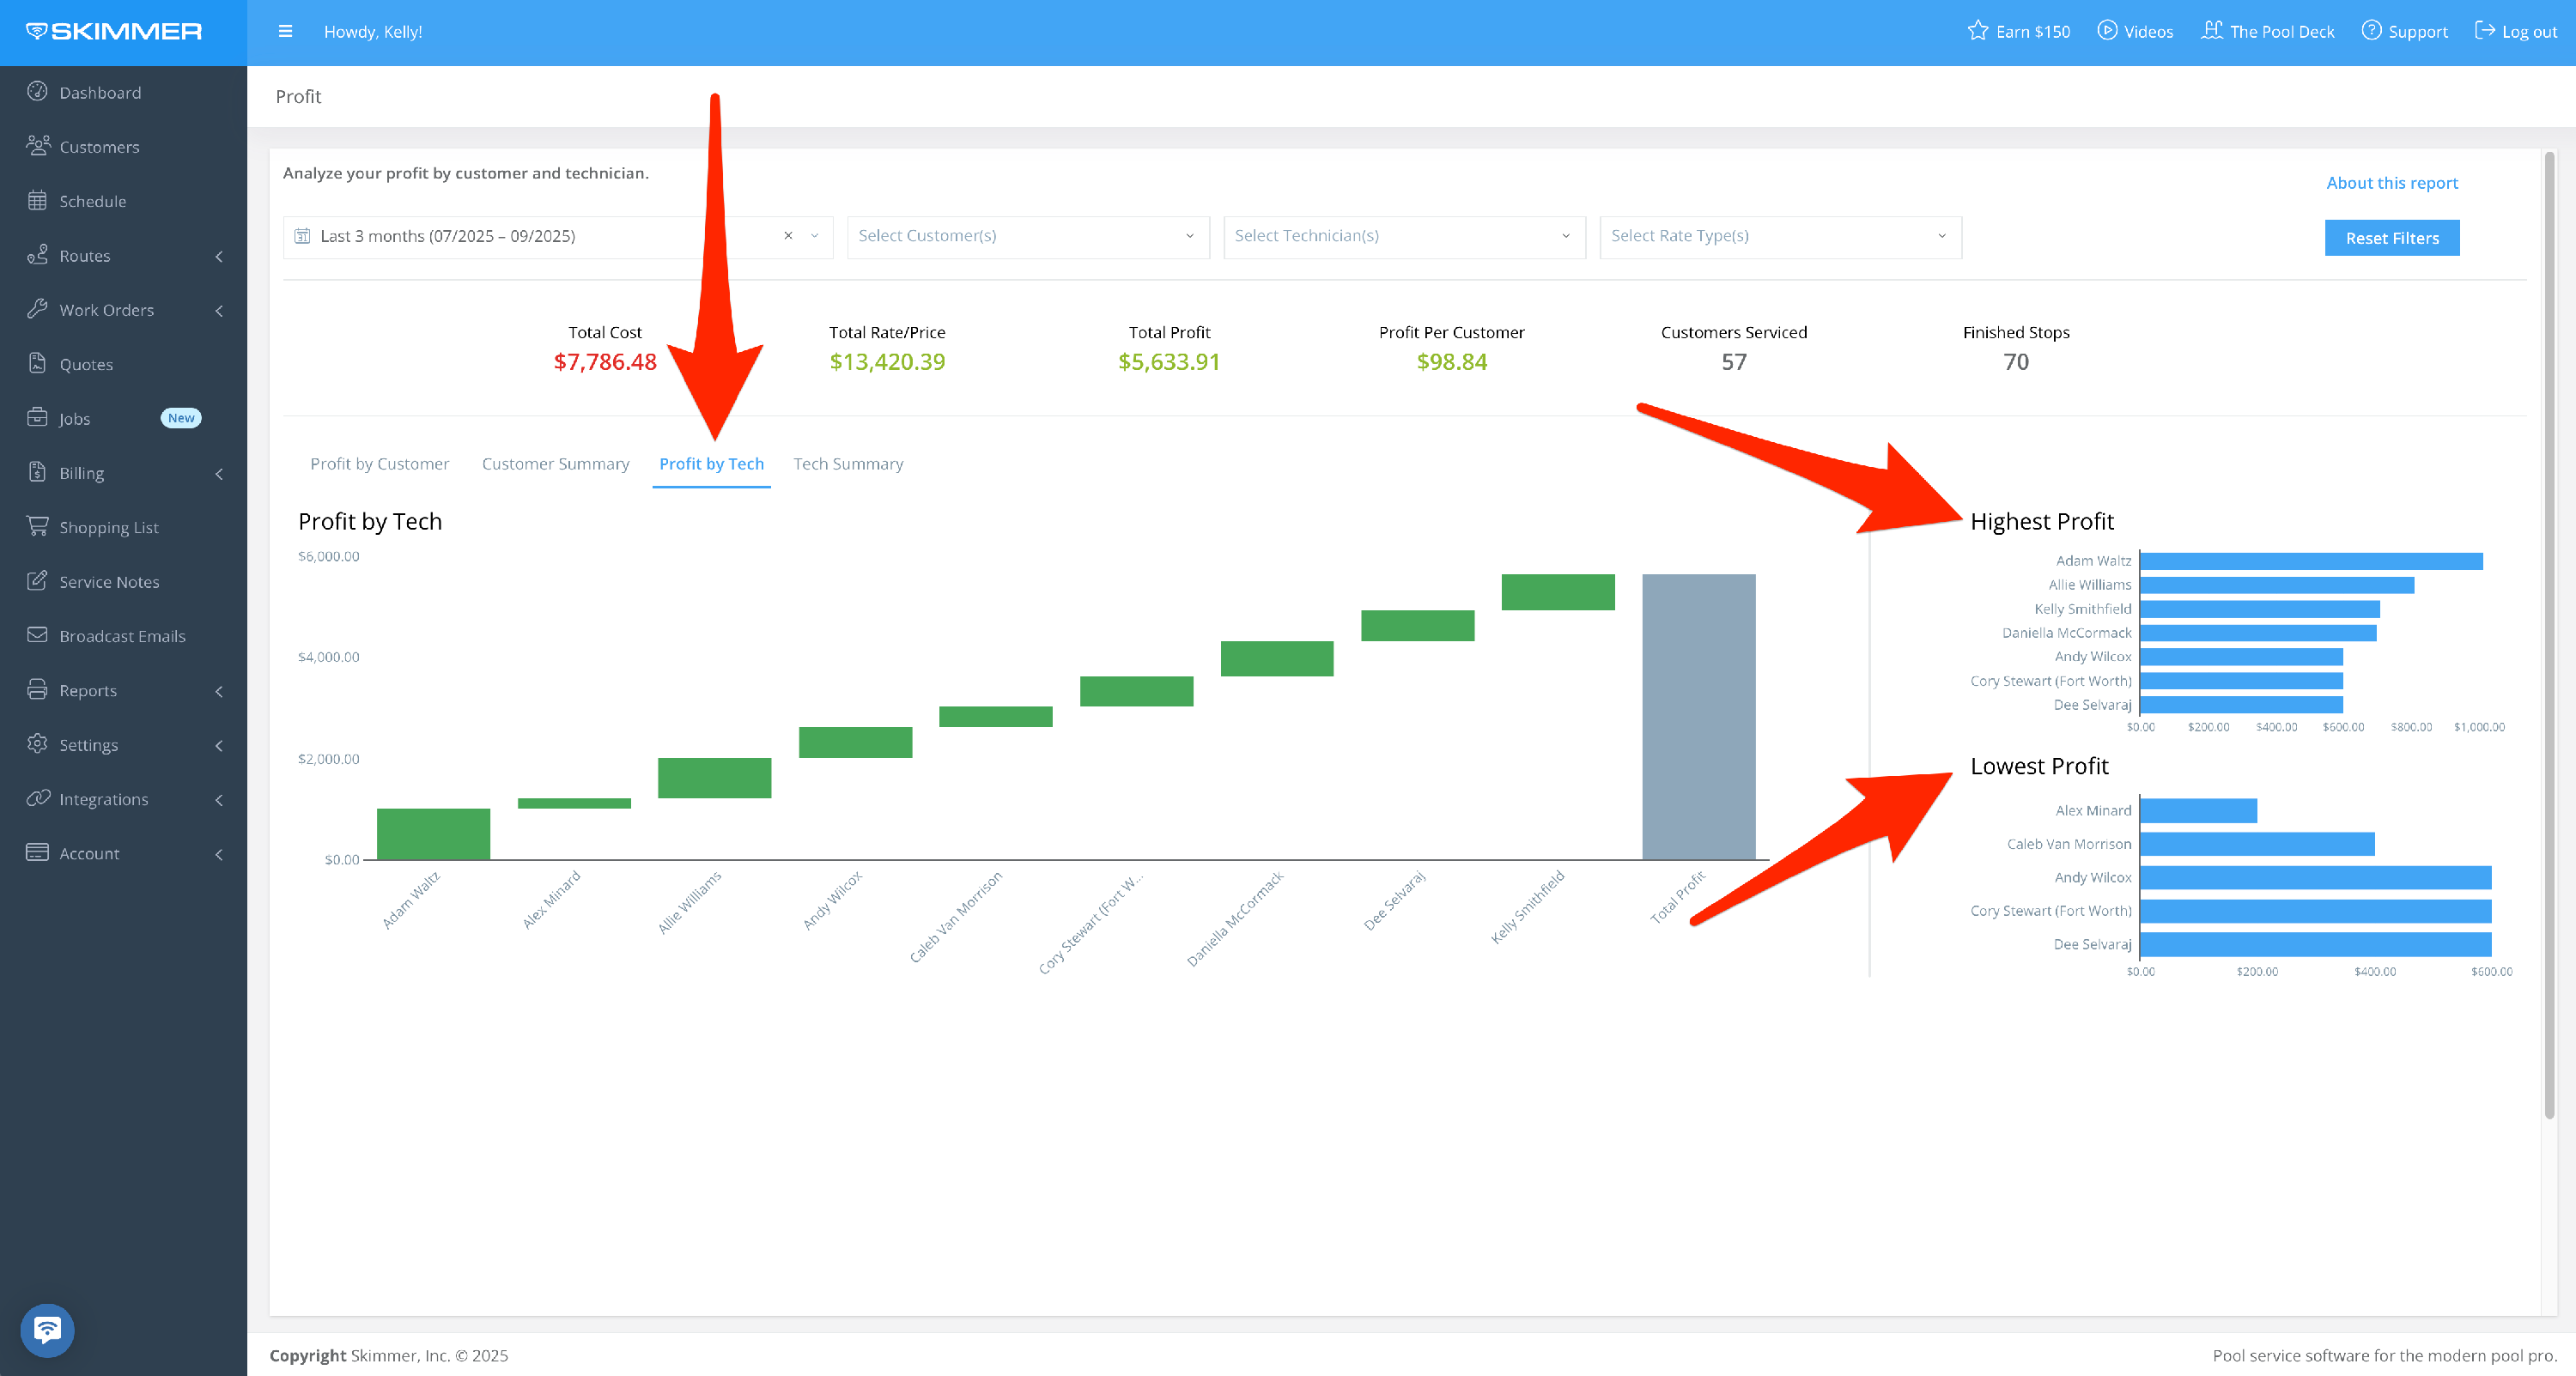
- Profit by Tech gives you the same data, just organized by the tech who did the work and showing highest and lowest profit.
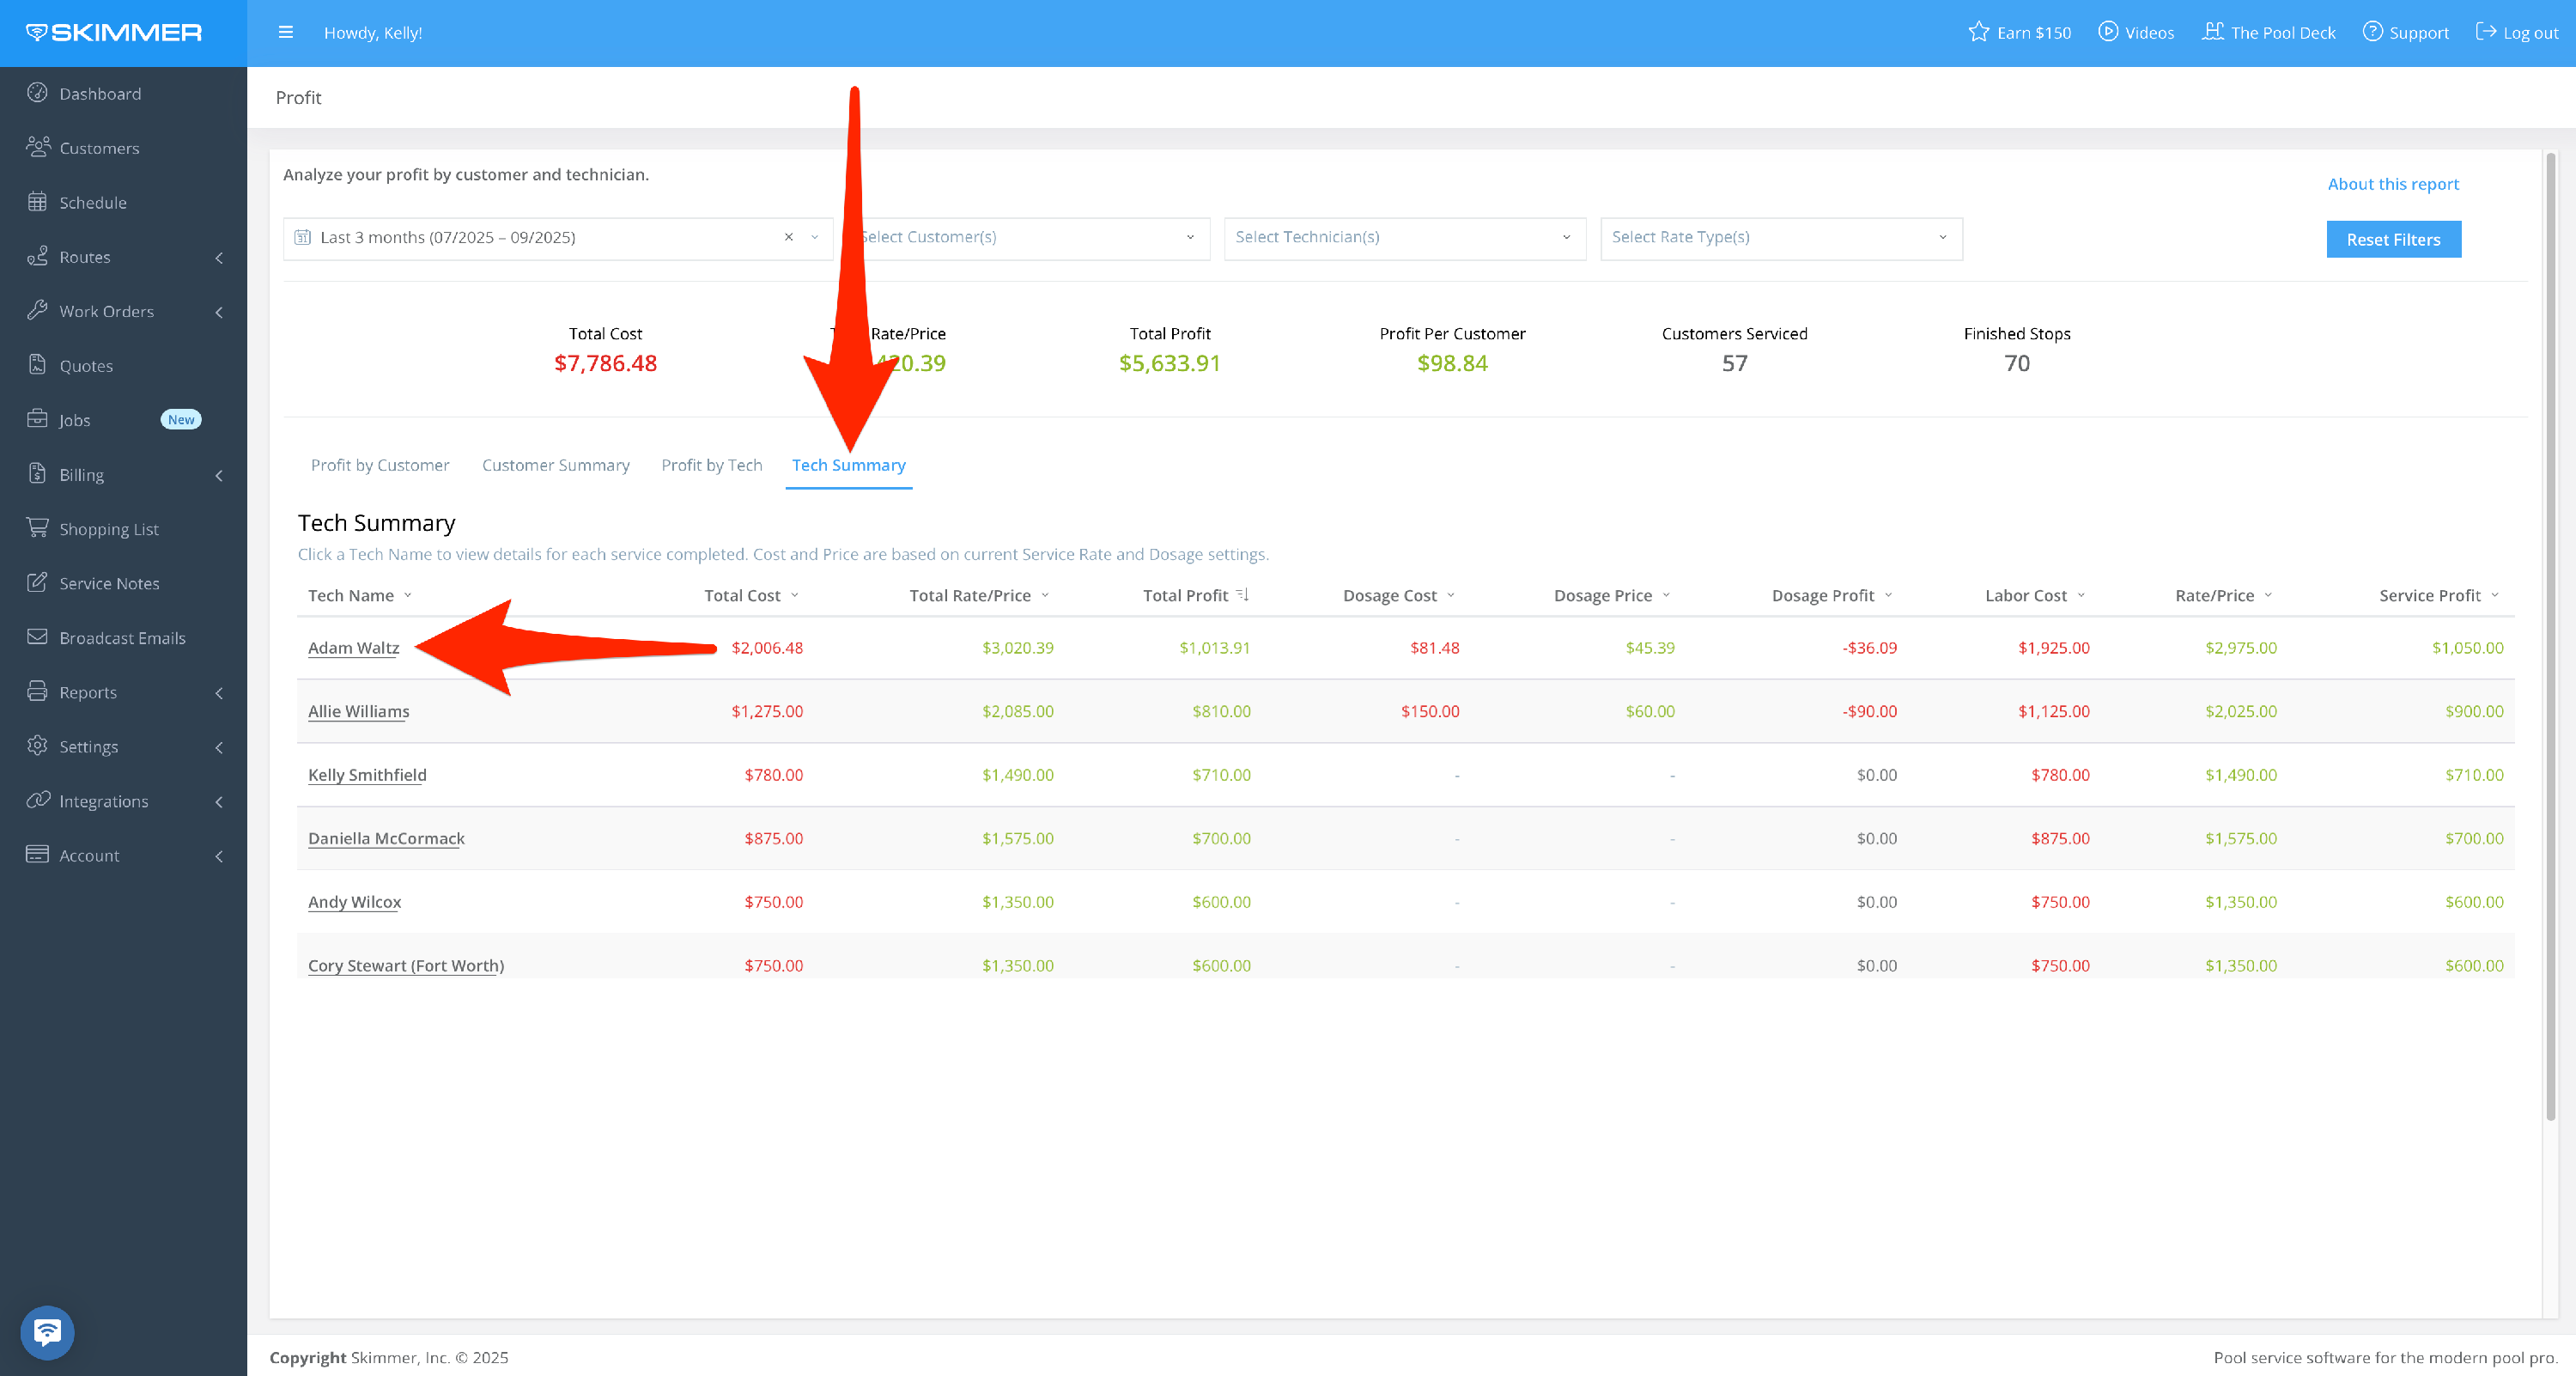
- Tech Summary also gives the full breakdown of how you arrived at your profits, organized by tech.
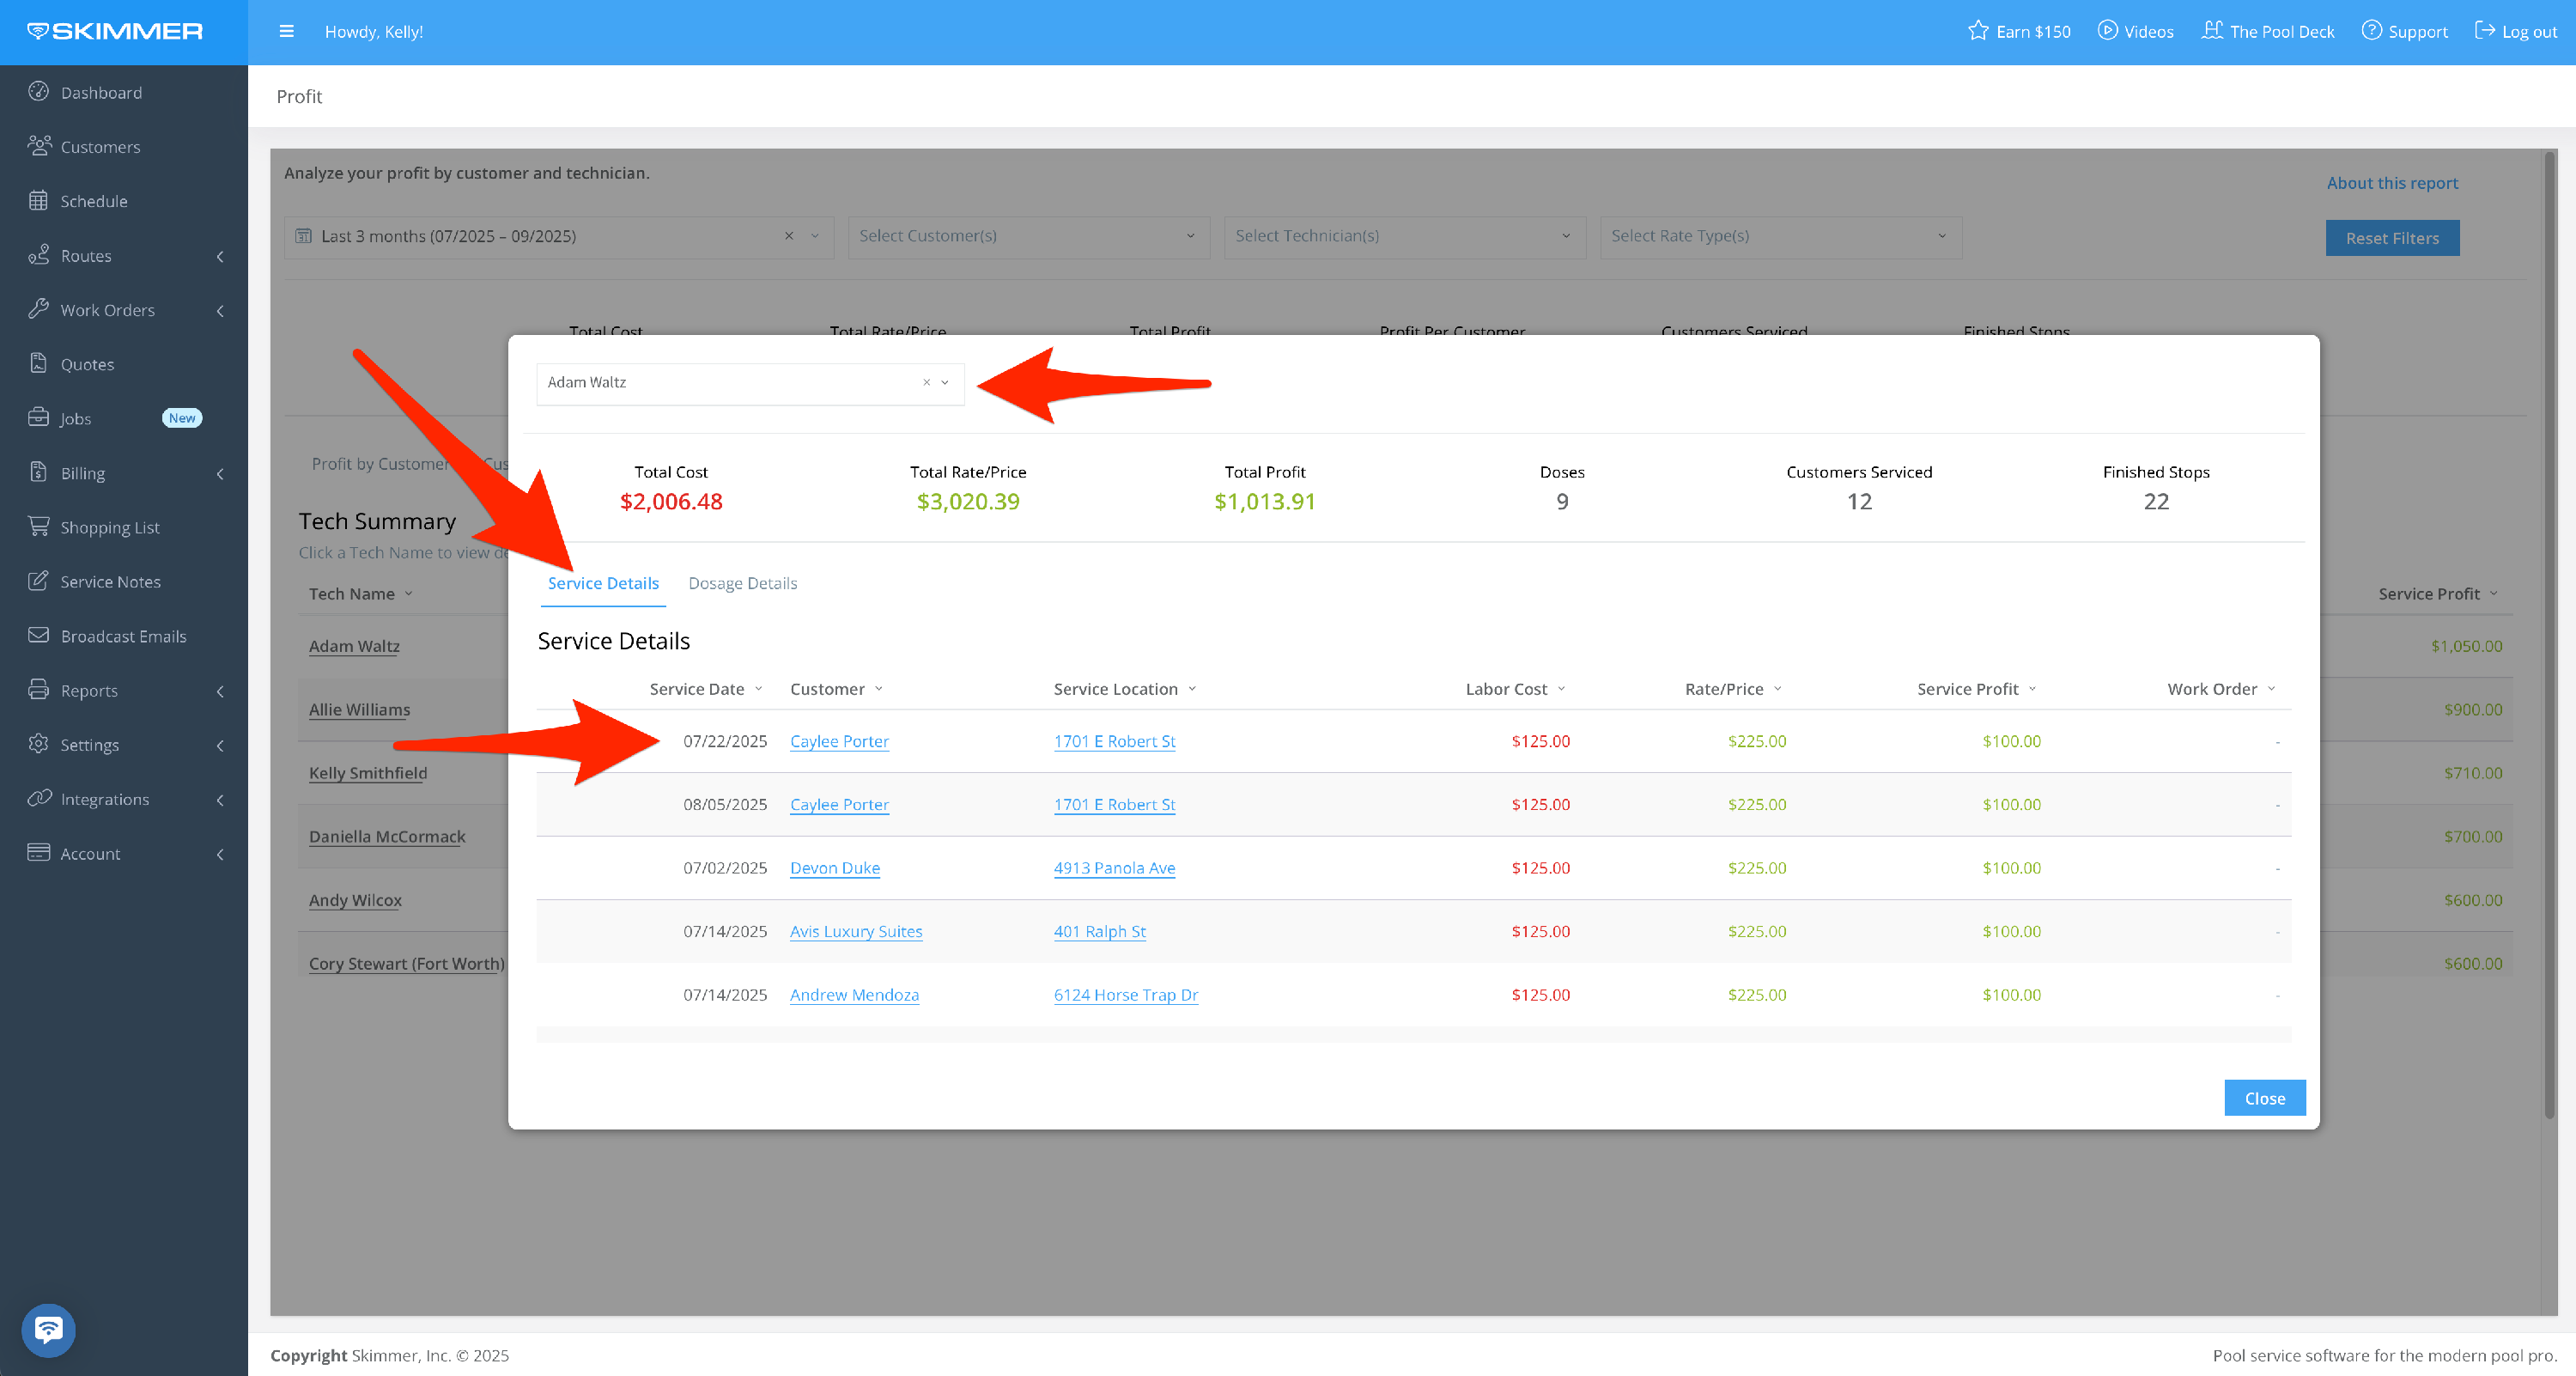
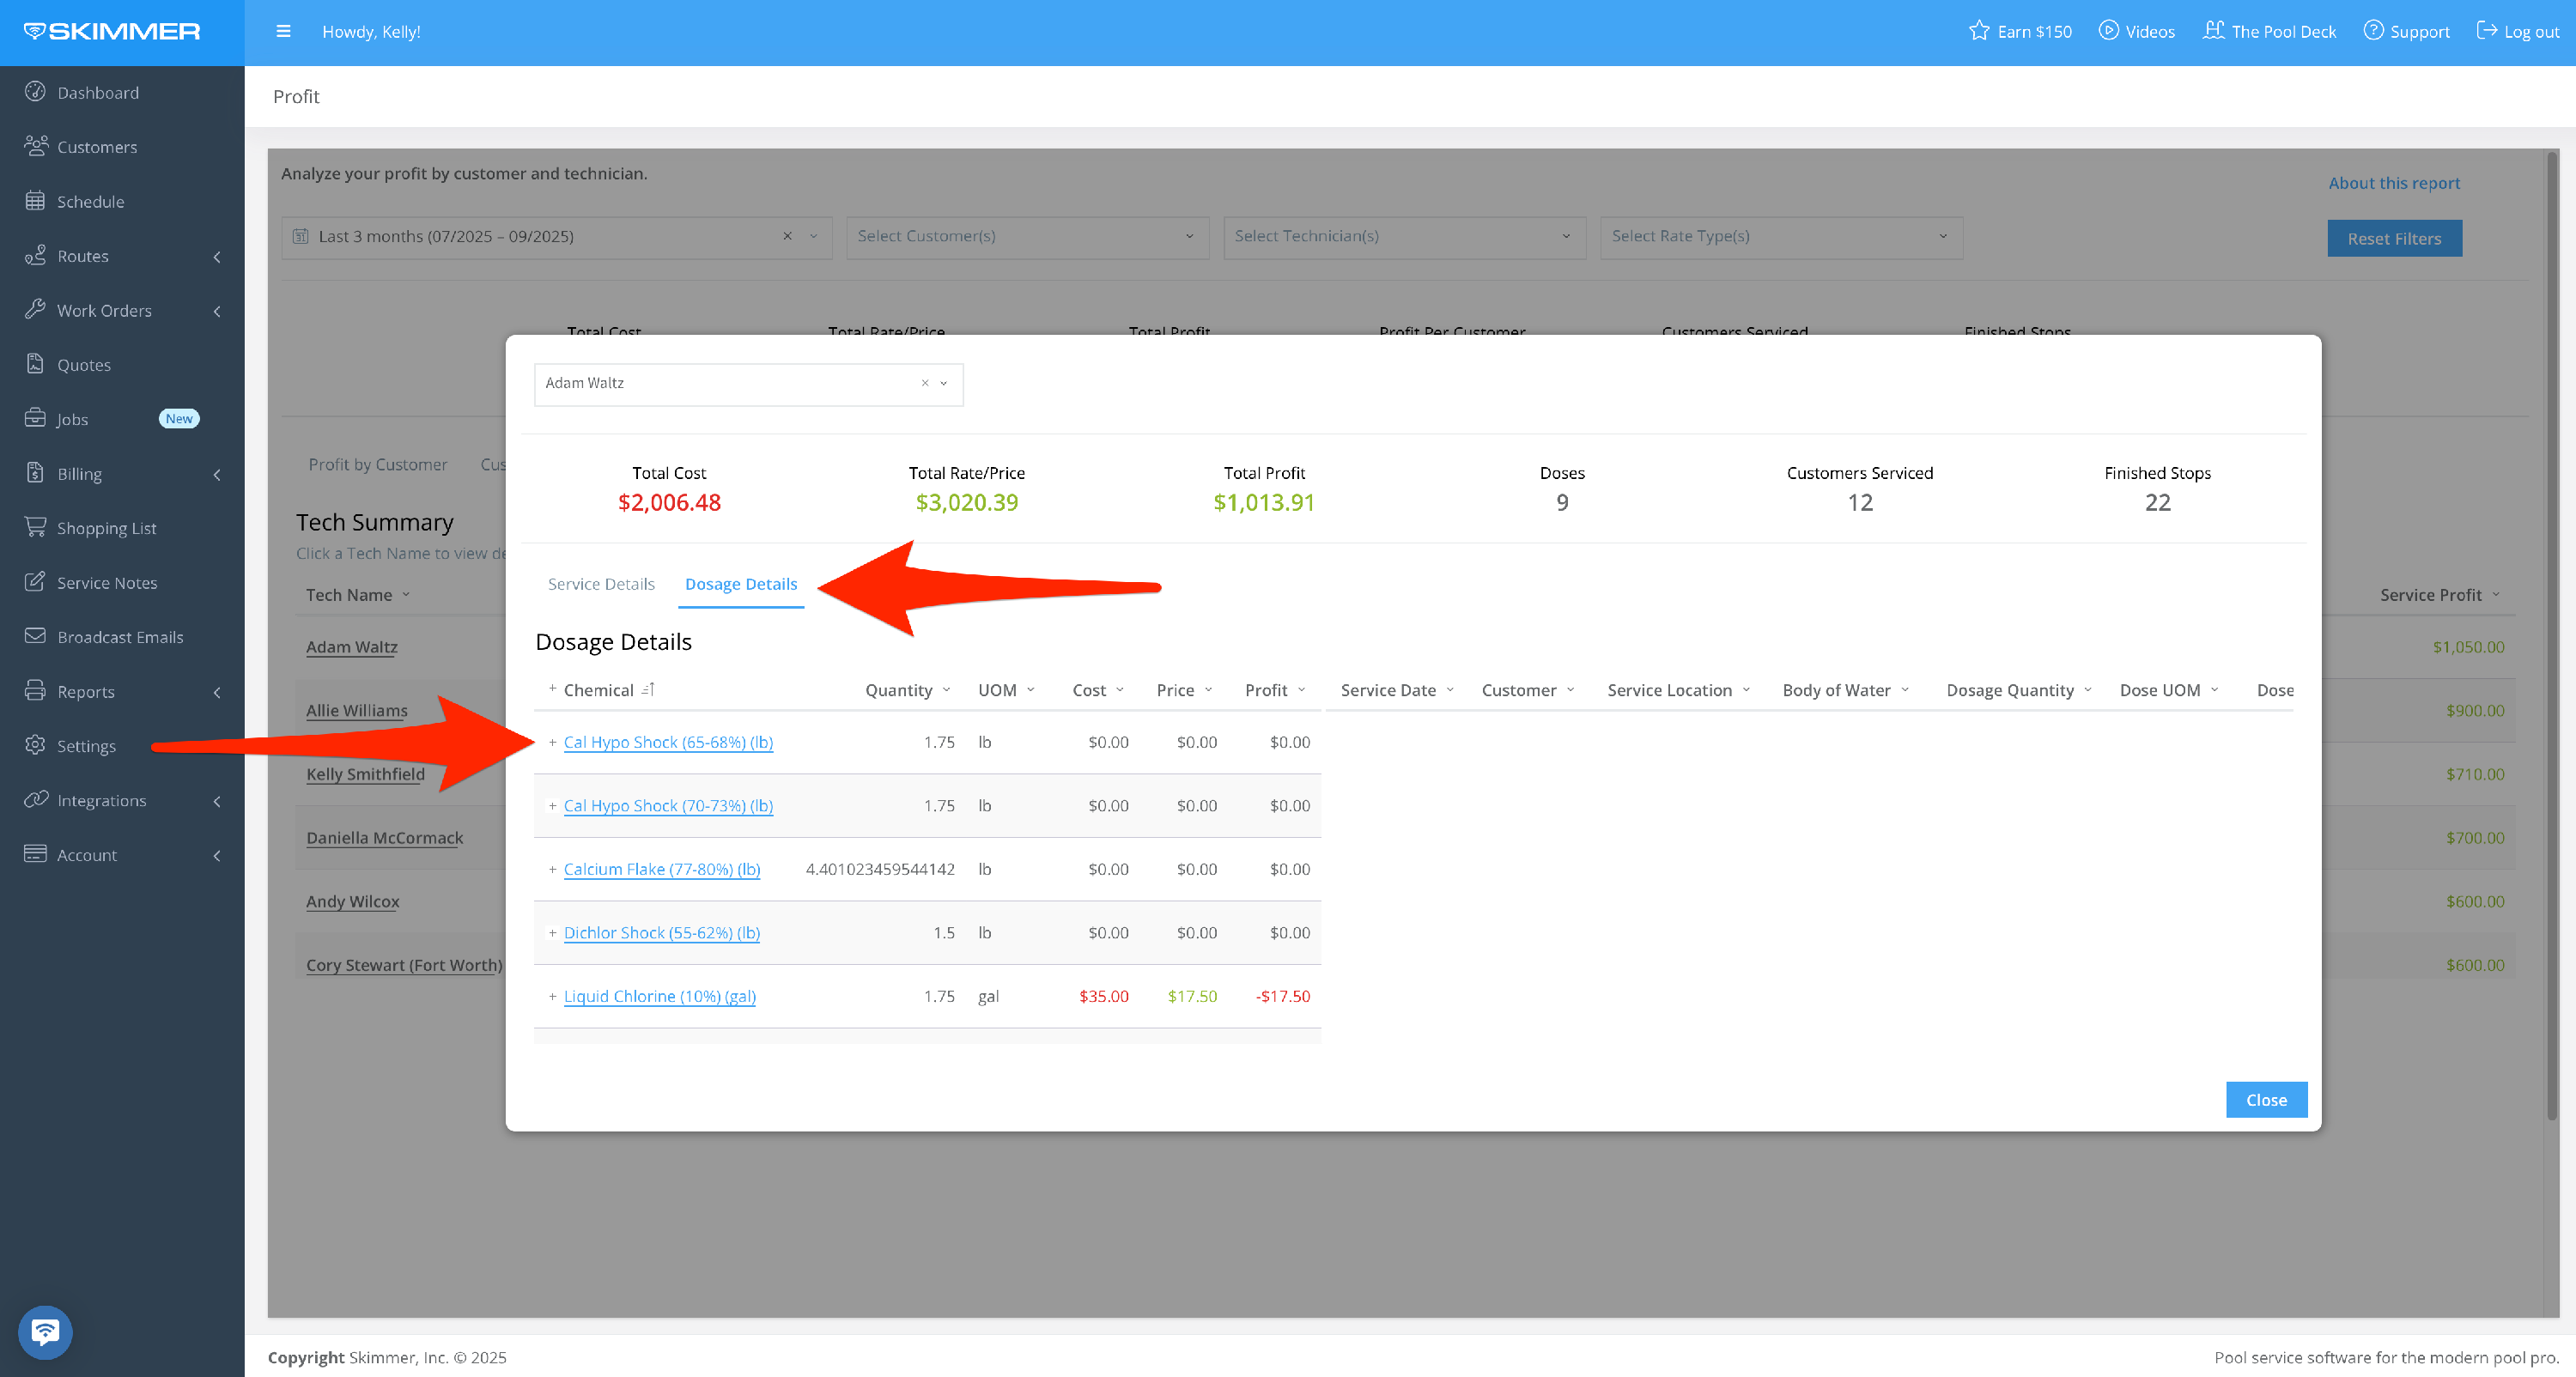
- For even more information, click on a tech’s name and the pop-up screen will show every customer and location serviced. You can also use the Tech dropdown to switch between techs without having to exit this view. The Service Details tab shows labor cost, rate, profit, and related service information. Dosage Details will display individual dosage values and related cost, rate, profit, and service information.
- 7
-
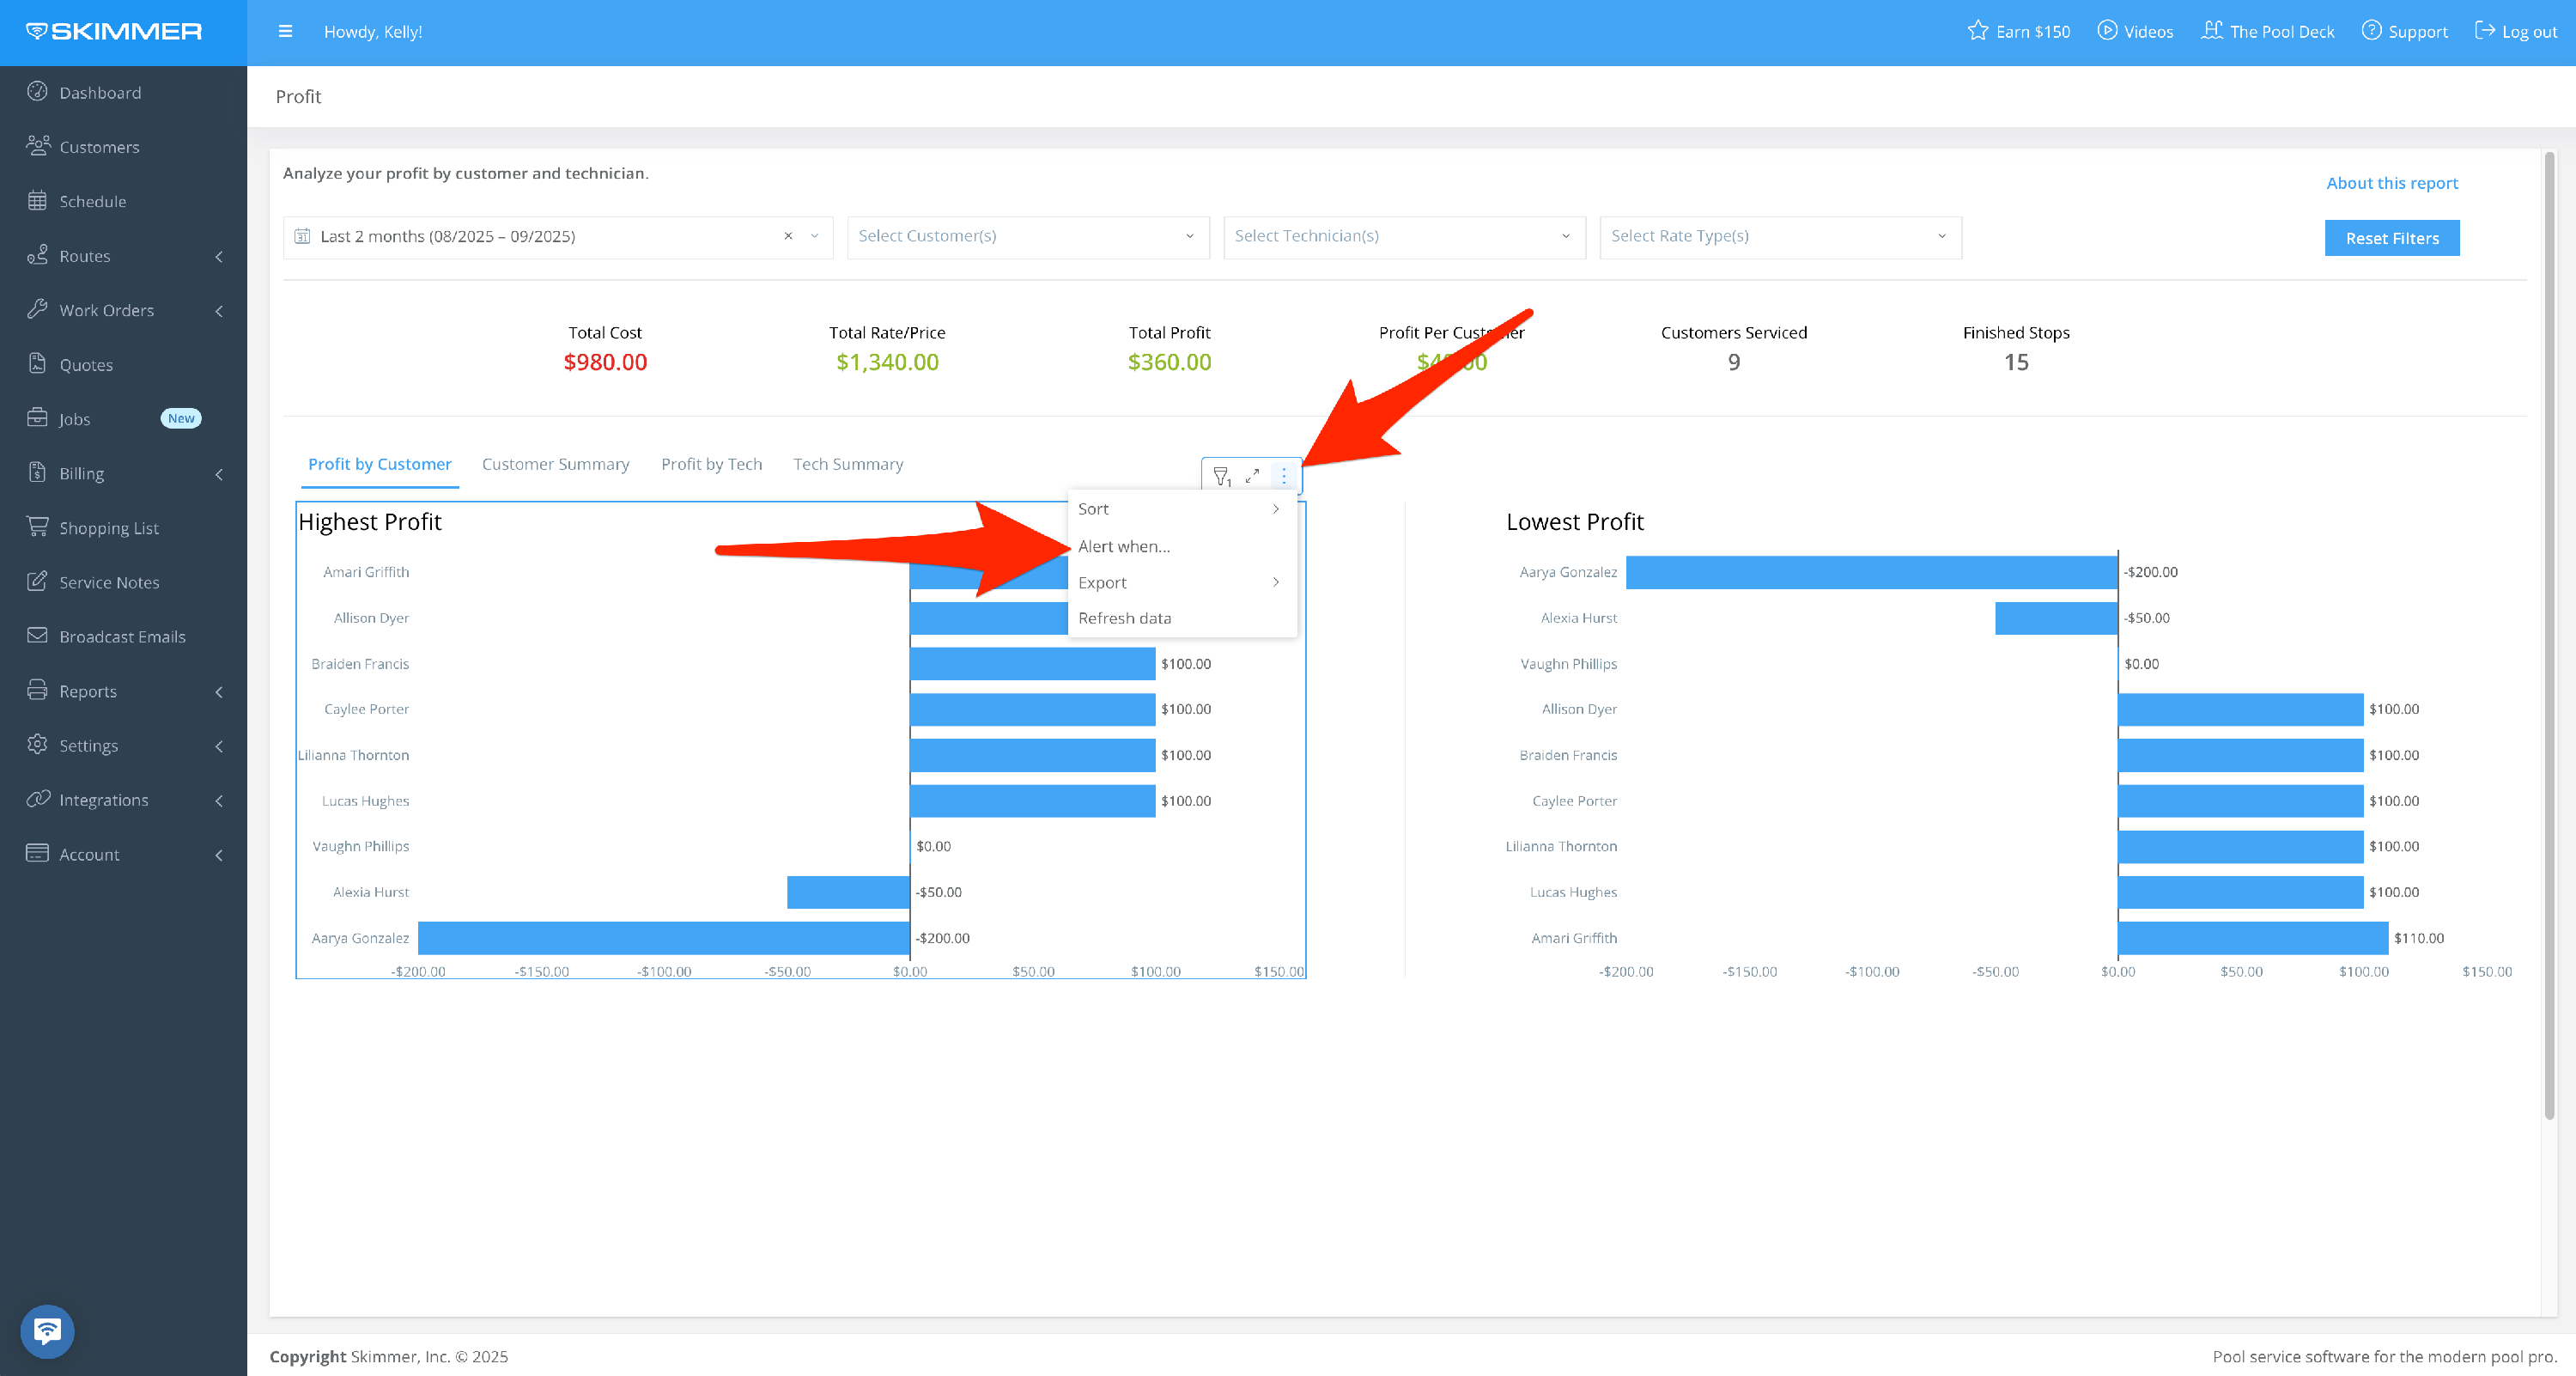
To export data:
- Hover or click on a chart or table. Find the three dots that appear in the top right of the frame and click. This will give you options for working with the data in the chart you selected, including the ability to export it in various formats. This is useful if you want to view and analyze the information in your own way.
- If you export as a PDF or PNG, you’ll get an image of what you selected. If you export to Excel or CSV, you’ll get a table with the underlying data. These options will download the export directly to your computer.
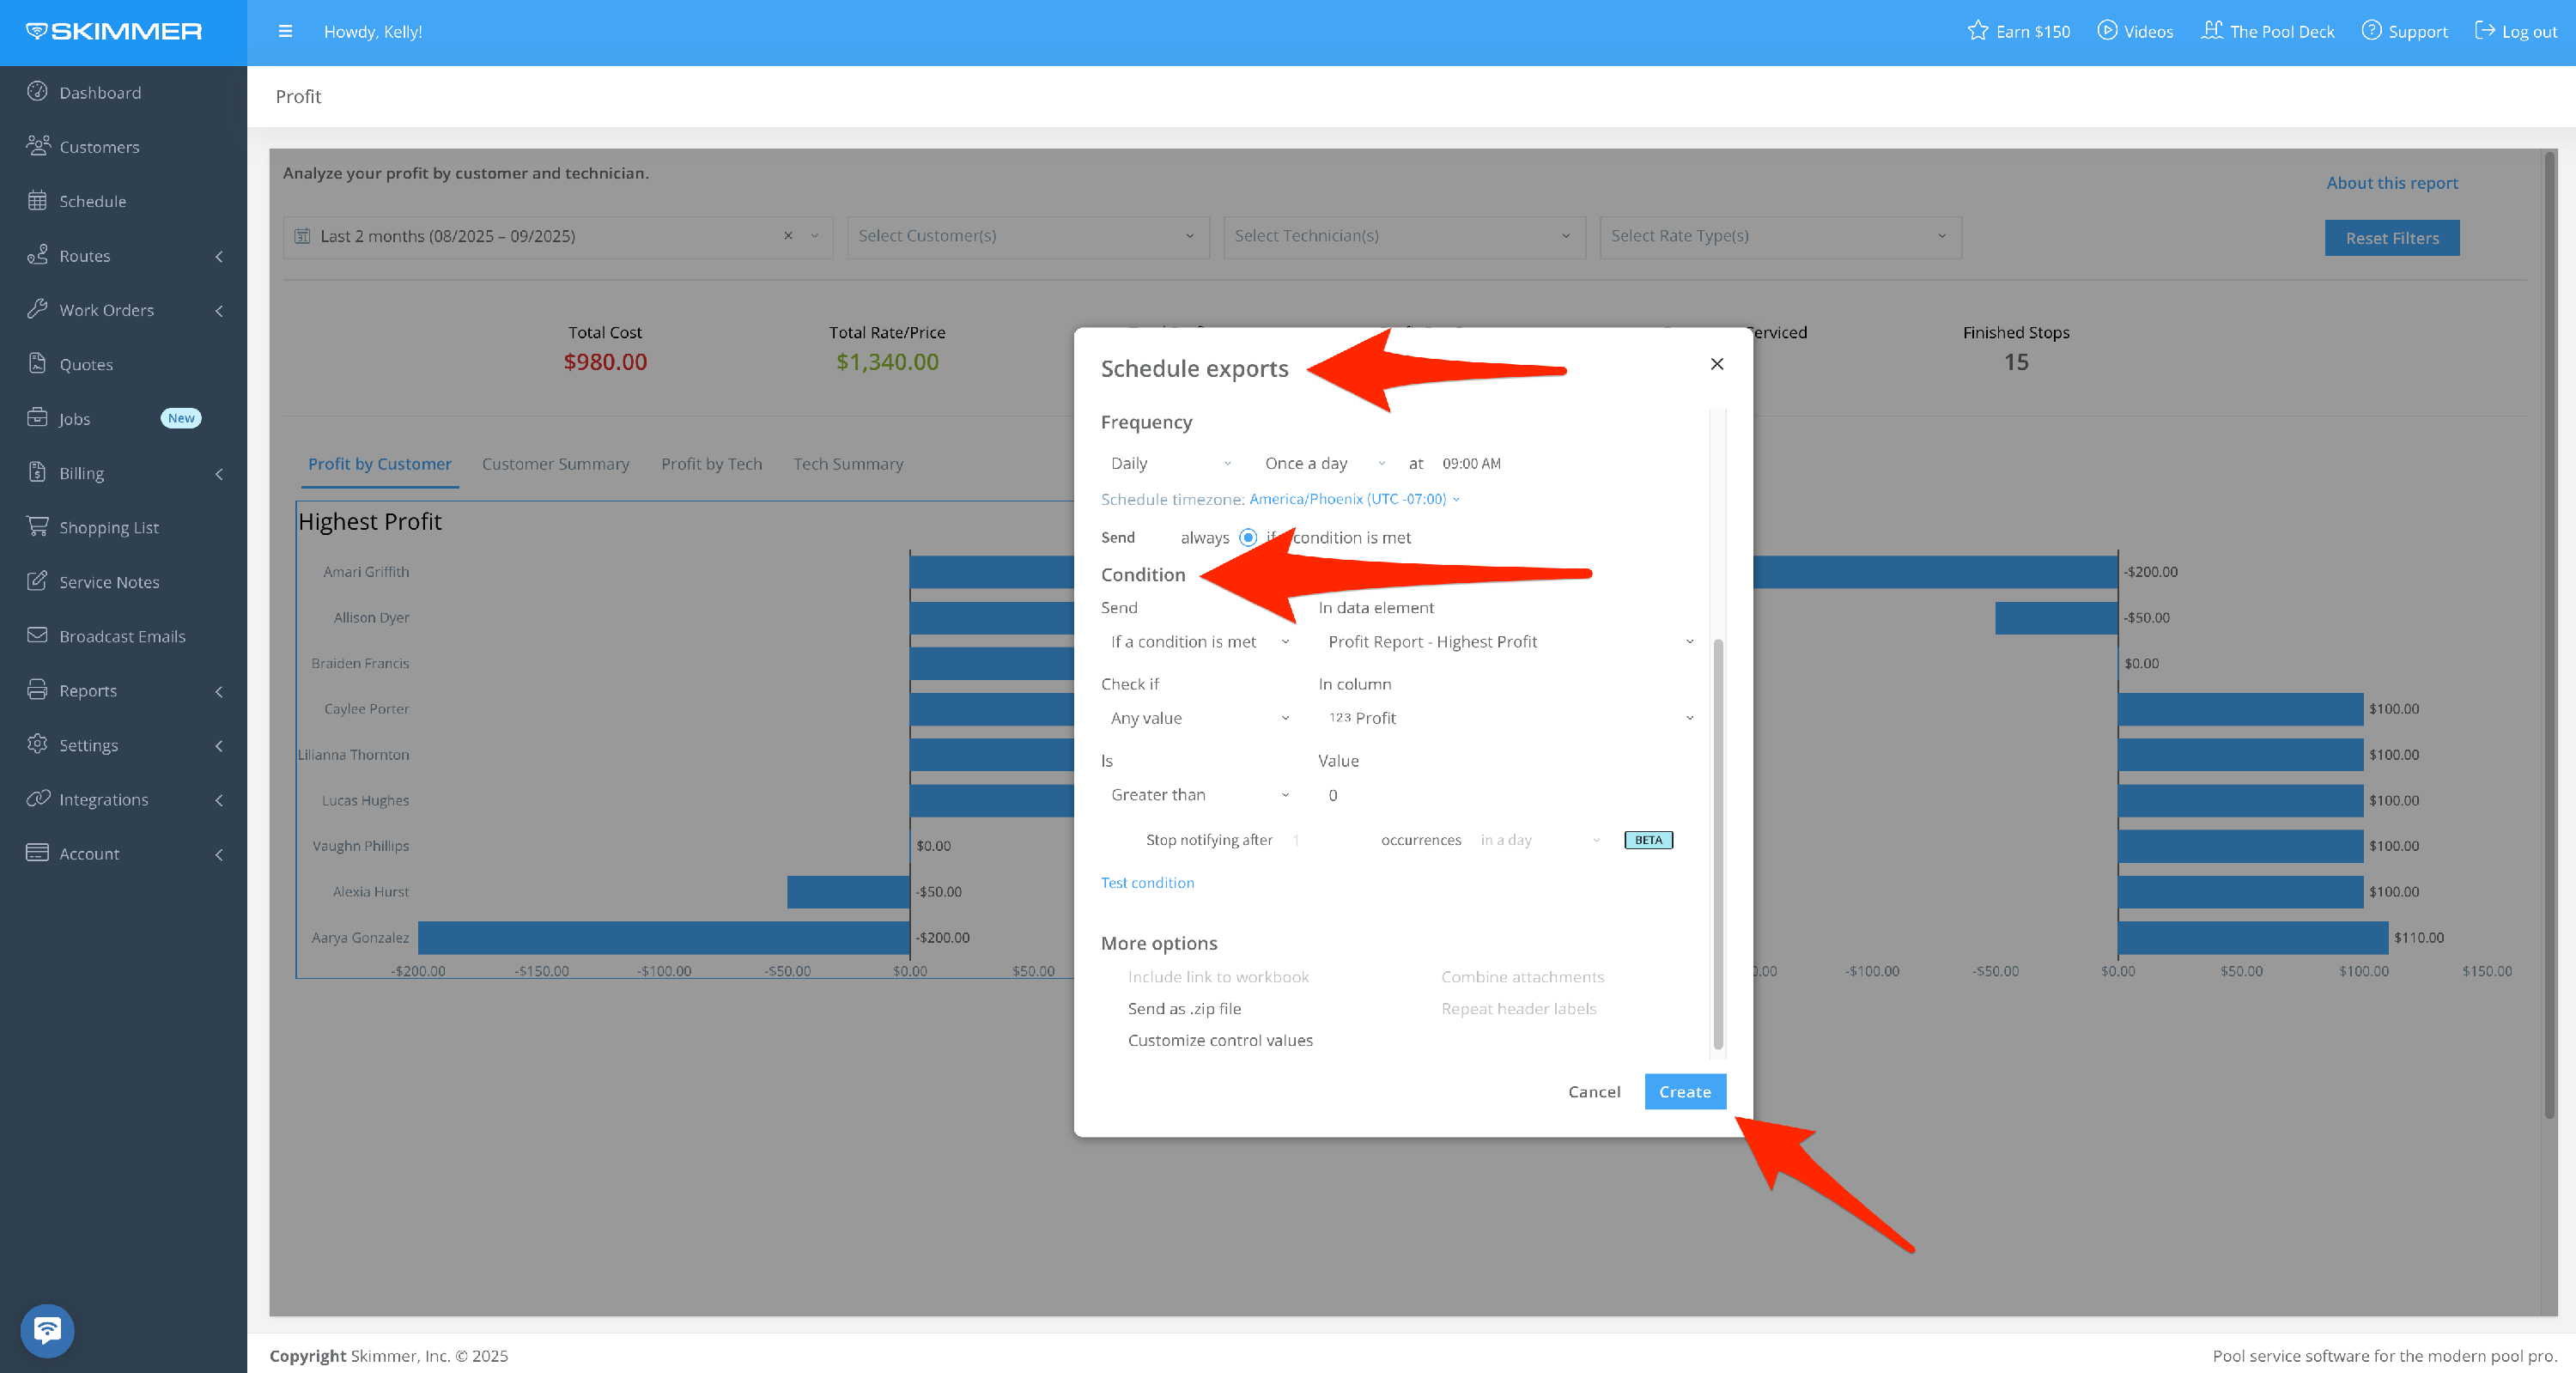
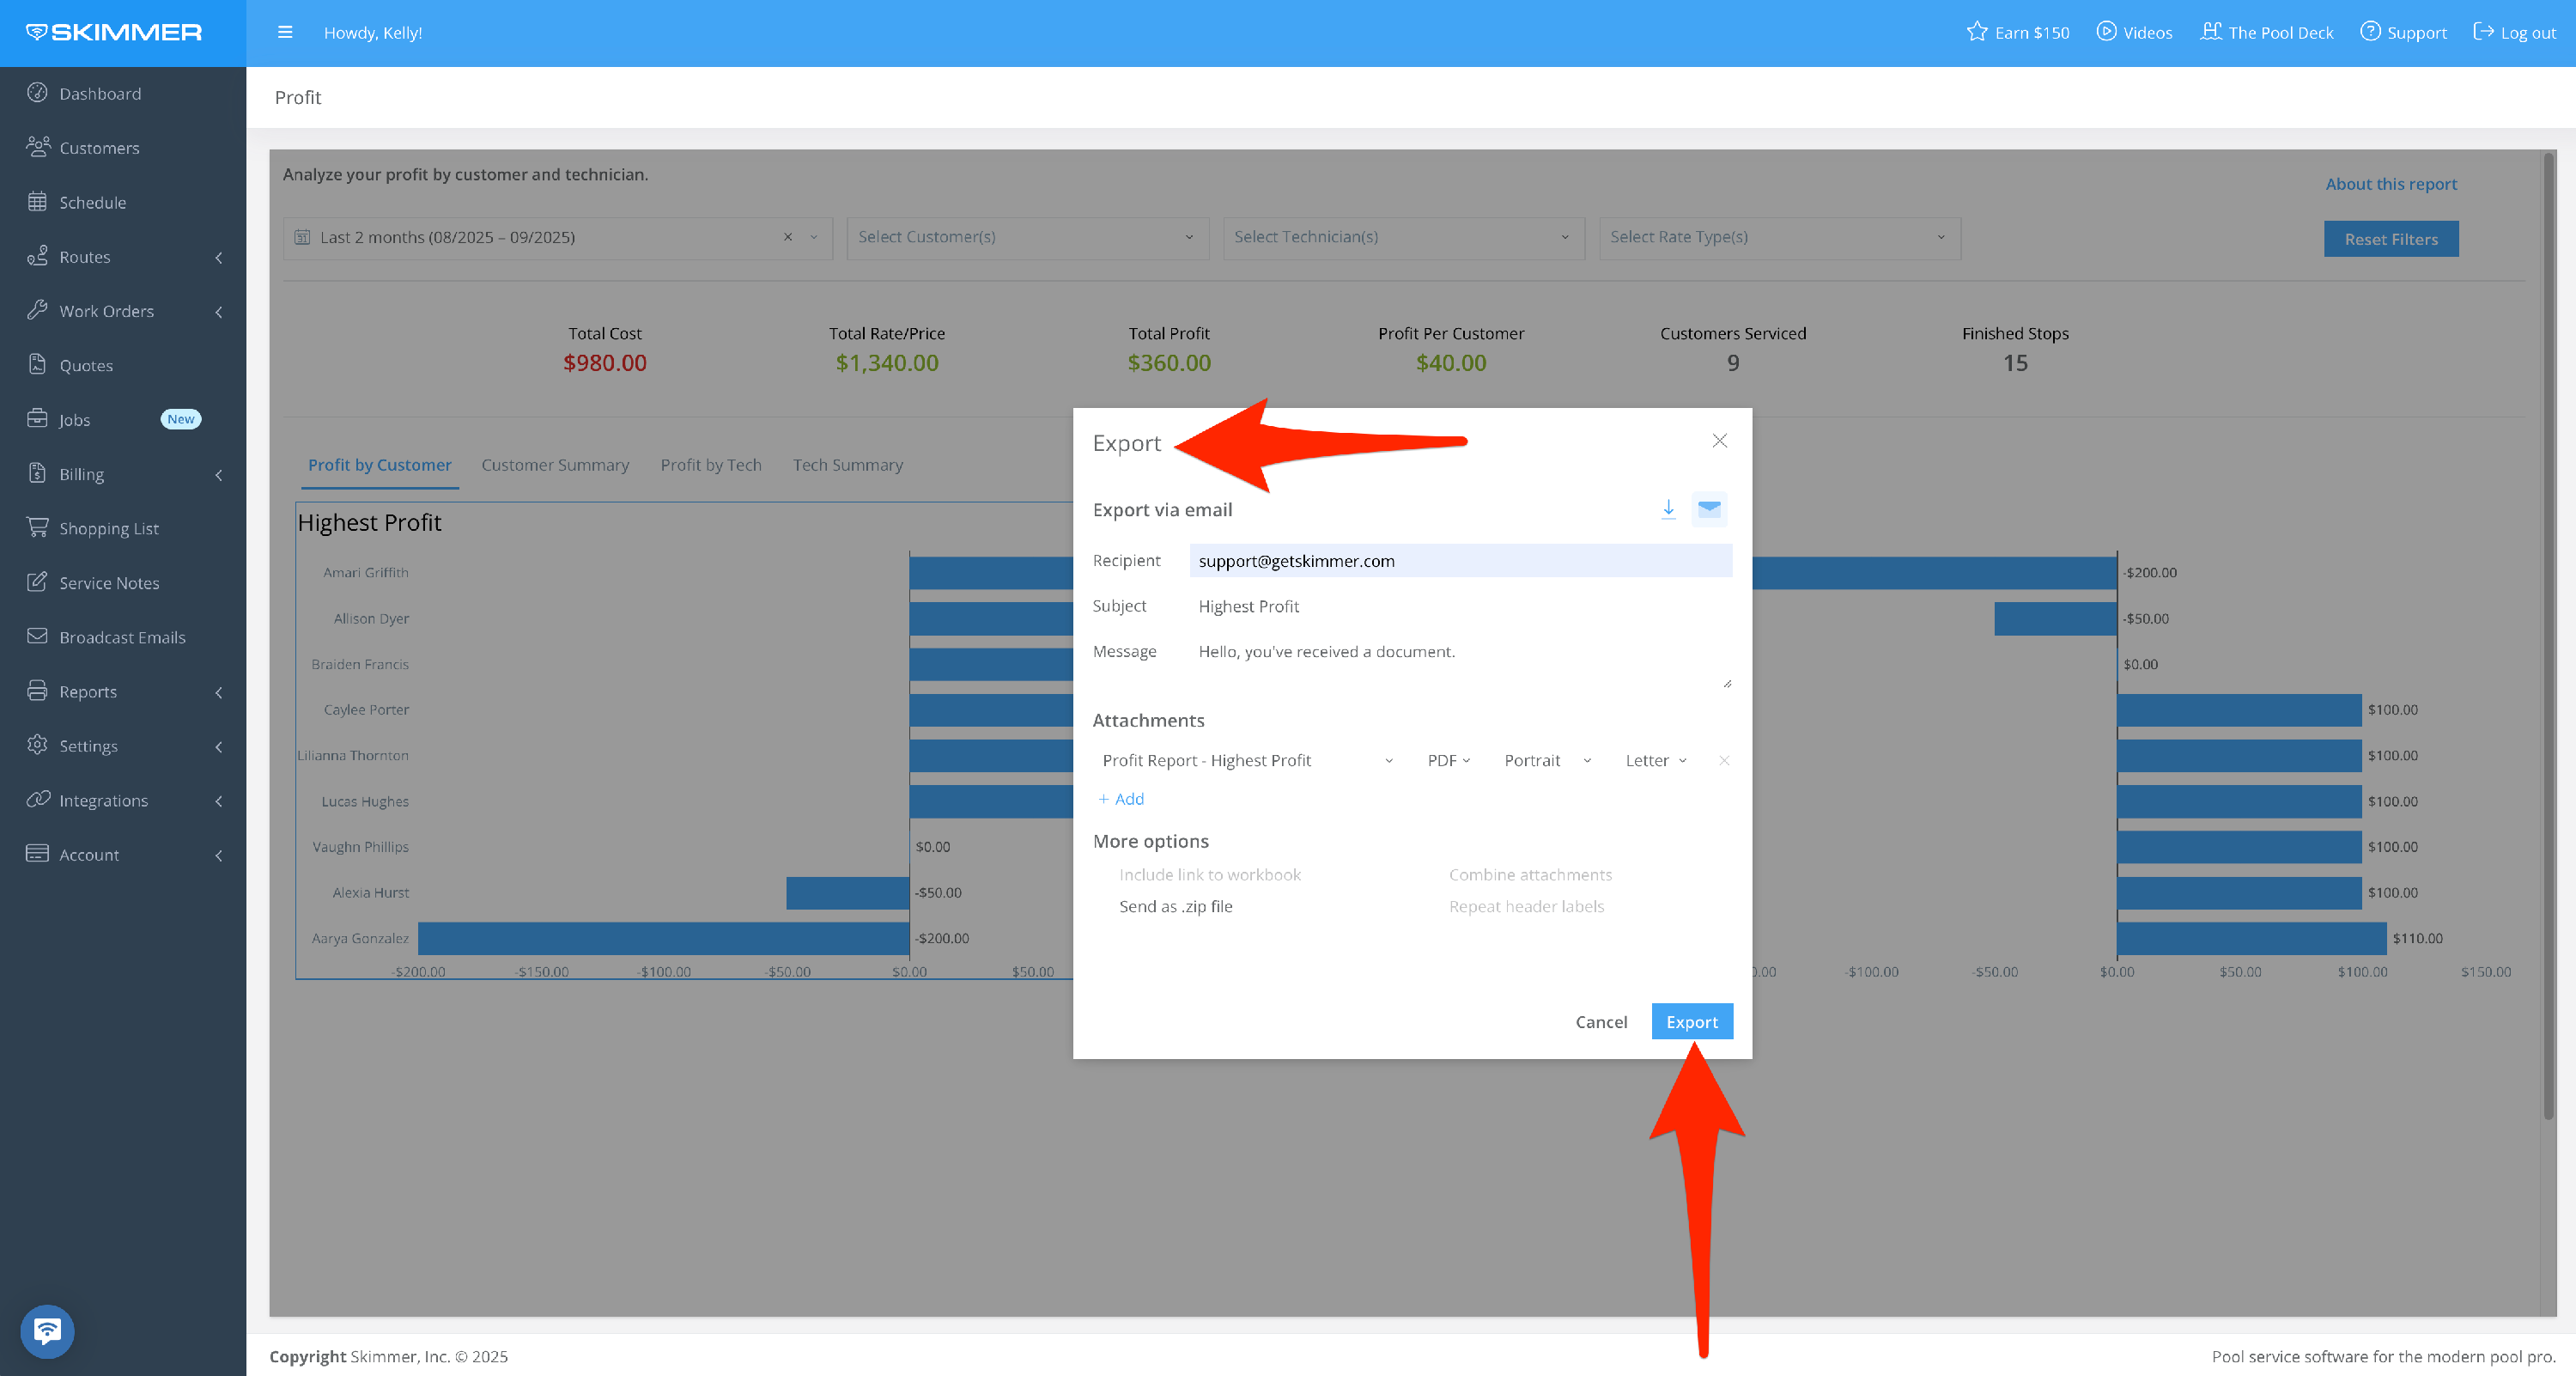
- You can also Send > Export, which also allows you email it. With the email option, you can also choose format and recipients, schedule a day and time for that email to send, and customize a schedule for a recurring email export going forward.
- 8
-
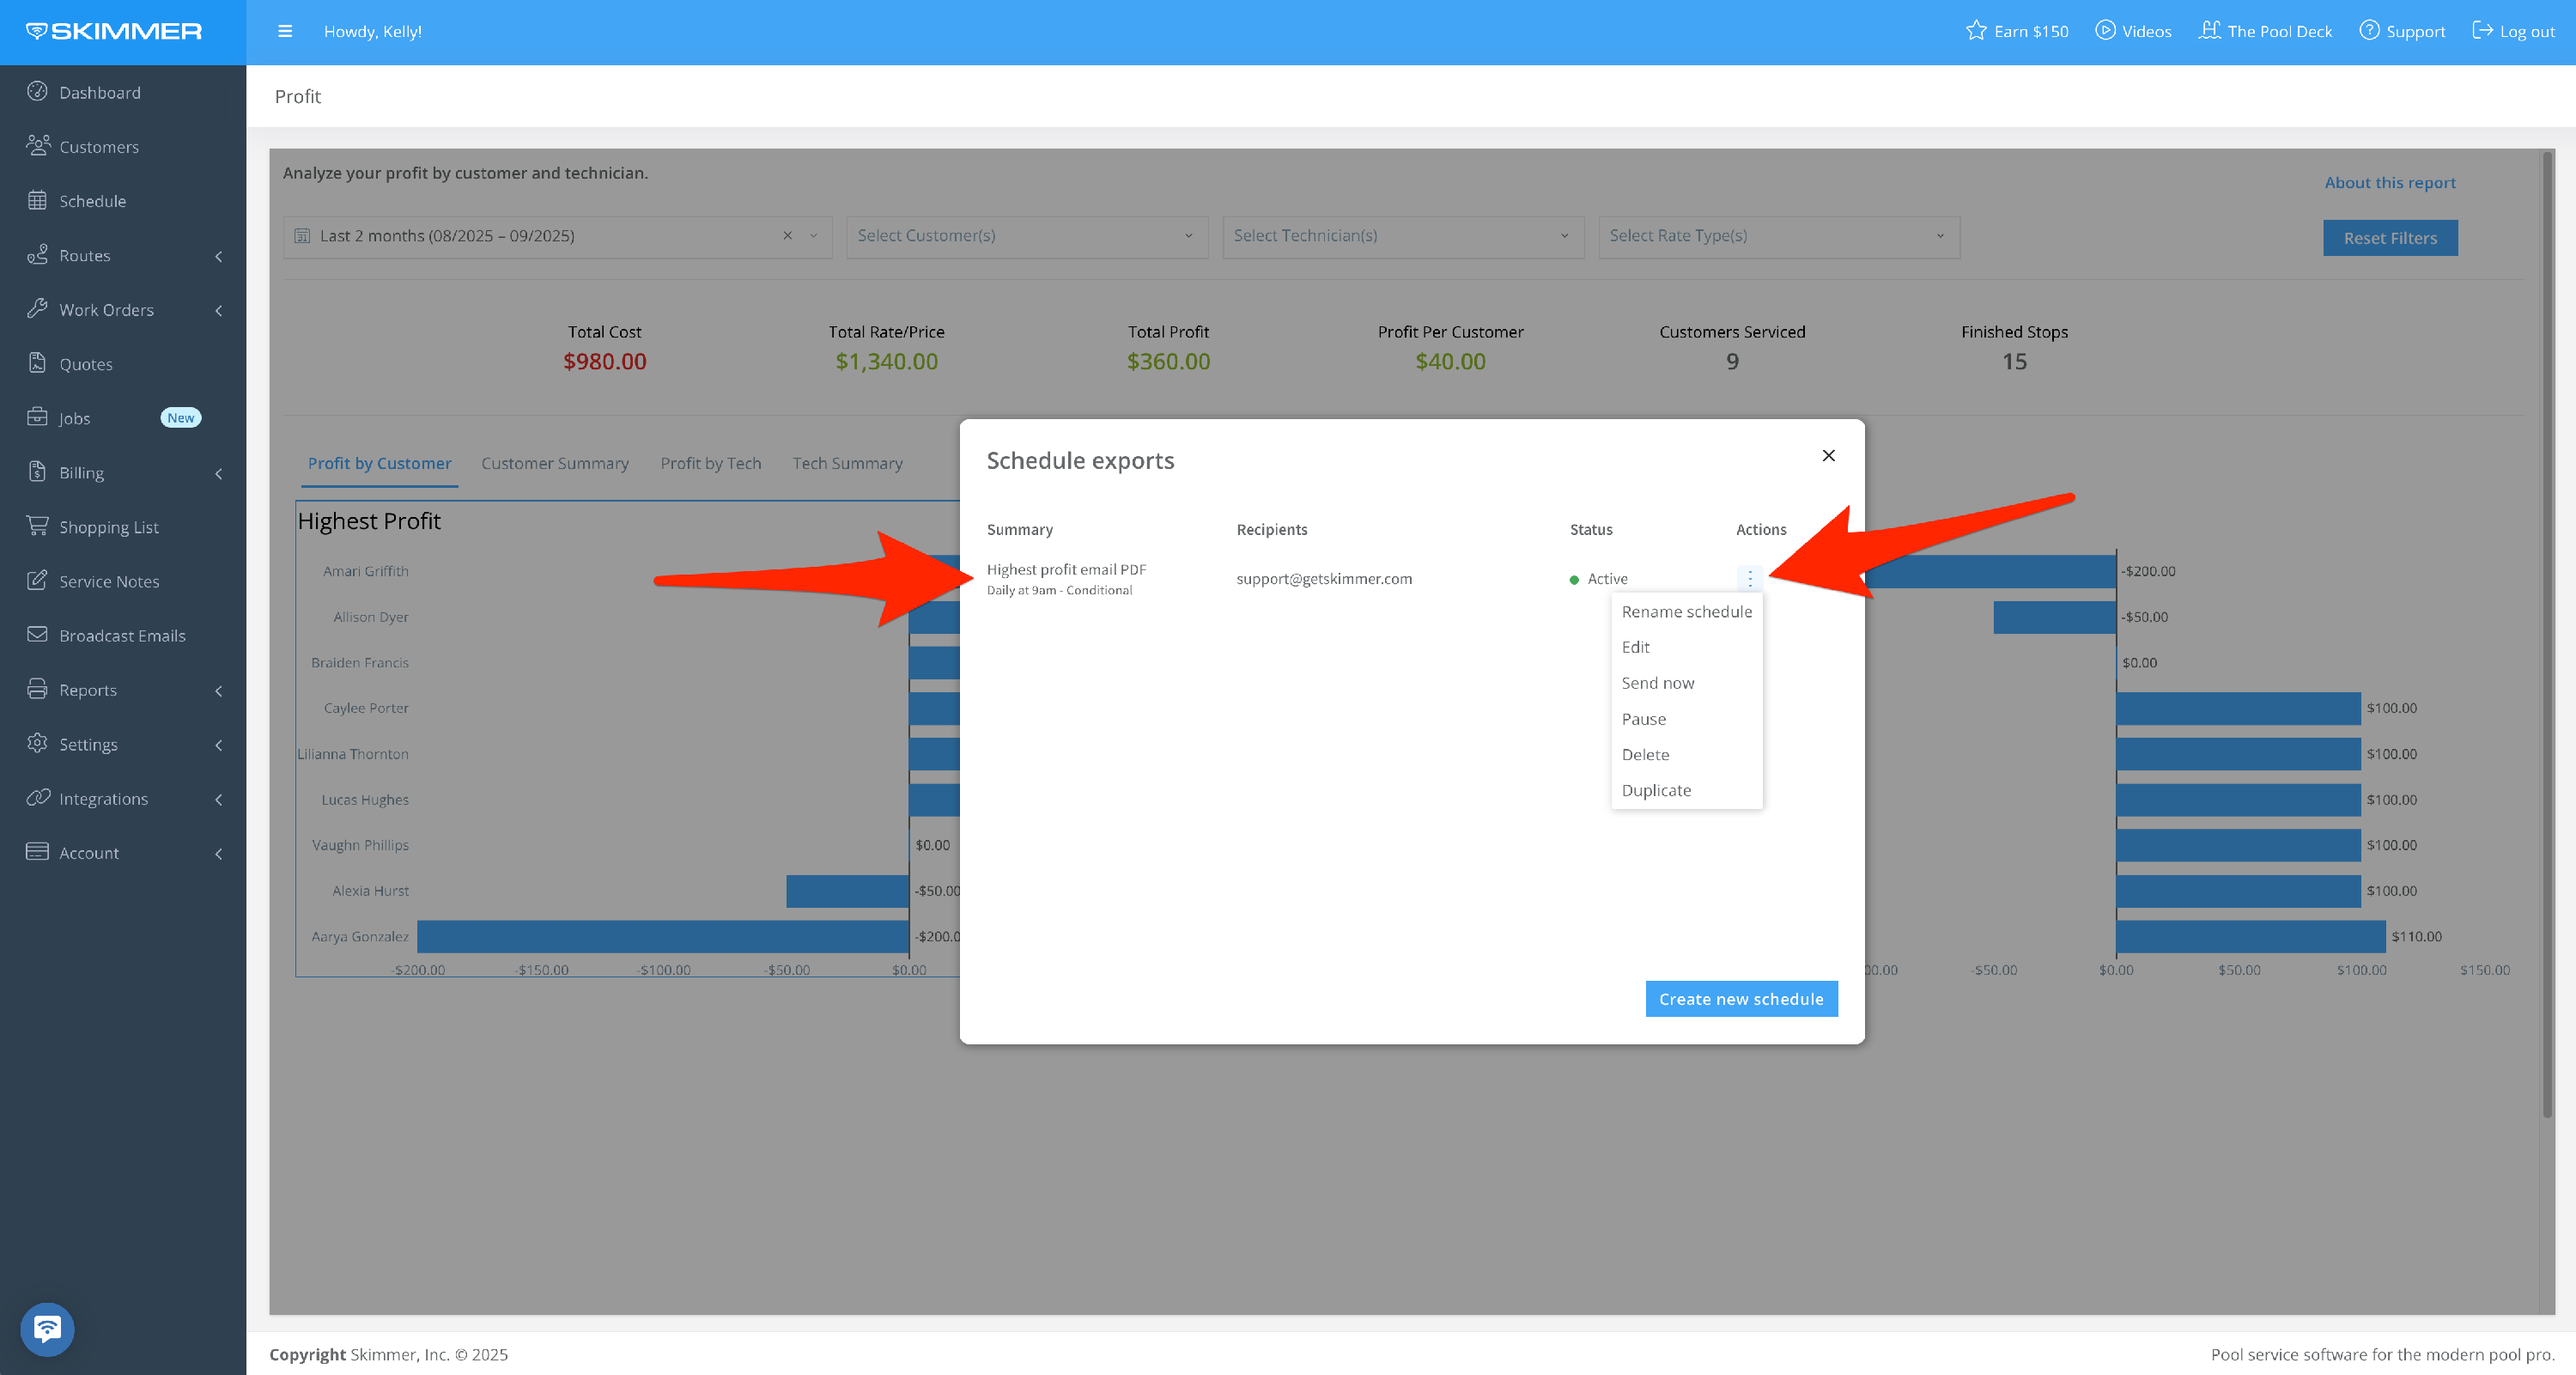
The “Alert When” option sets up an automatic export if the conditions you set are met. For instance, you can choose for the export to trigger if your cost exceeds a certain amount. The system does the monitoring of this condition for you and then triggers the export automatically. You can also select what supporting data you want to be included in the export, from a high-level summation to the whole text messages table. Once you create a scheduled export, you’ll have access to a table from which you can manage all of your scheduled exports, allowing you to edit/delete/duplicate/pause/manually send report at any time.