Chemical Dosages Report
Scroll down for a detailed guide on how to use this report.
Tiers: Scaling Up and above
Overview
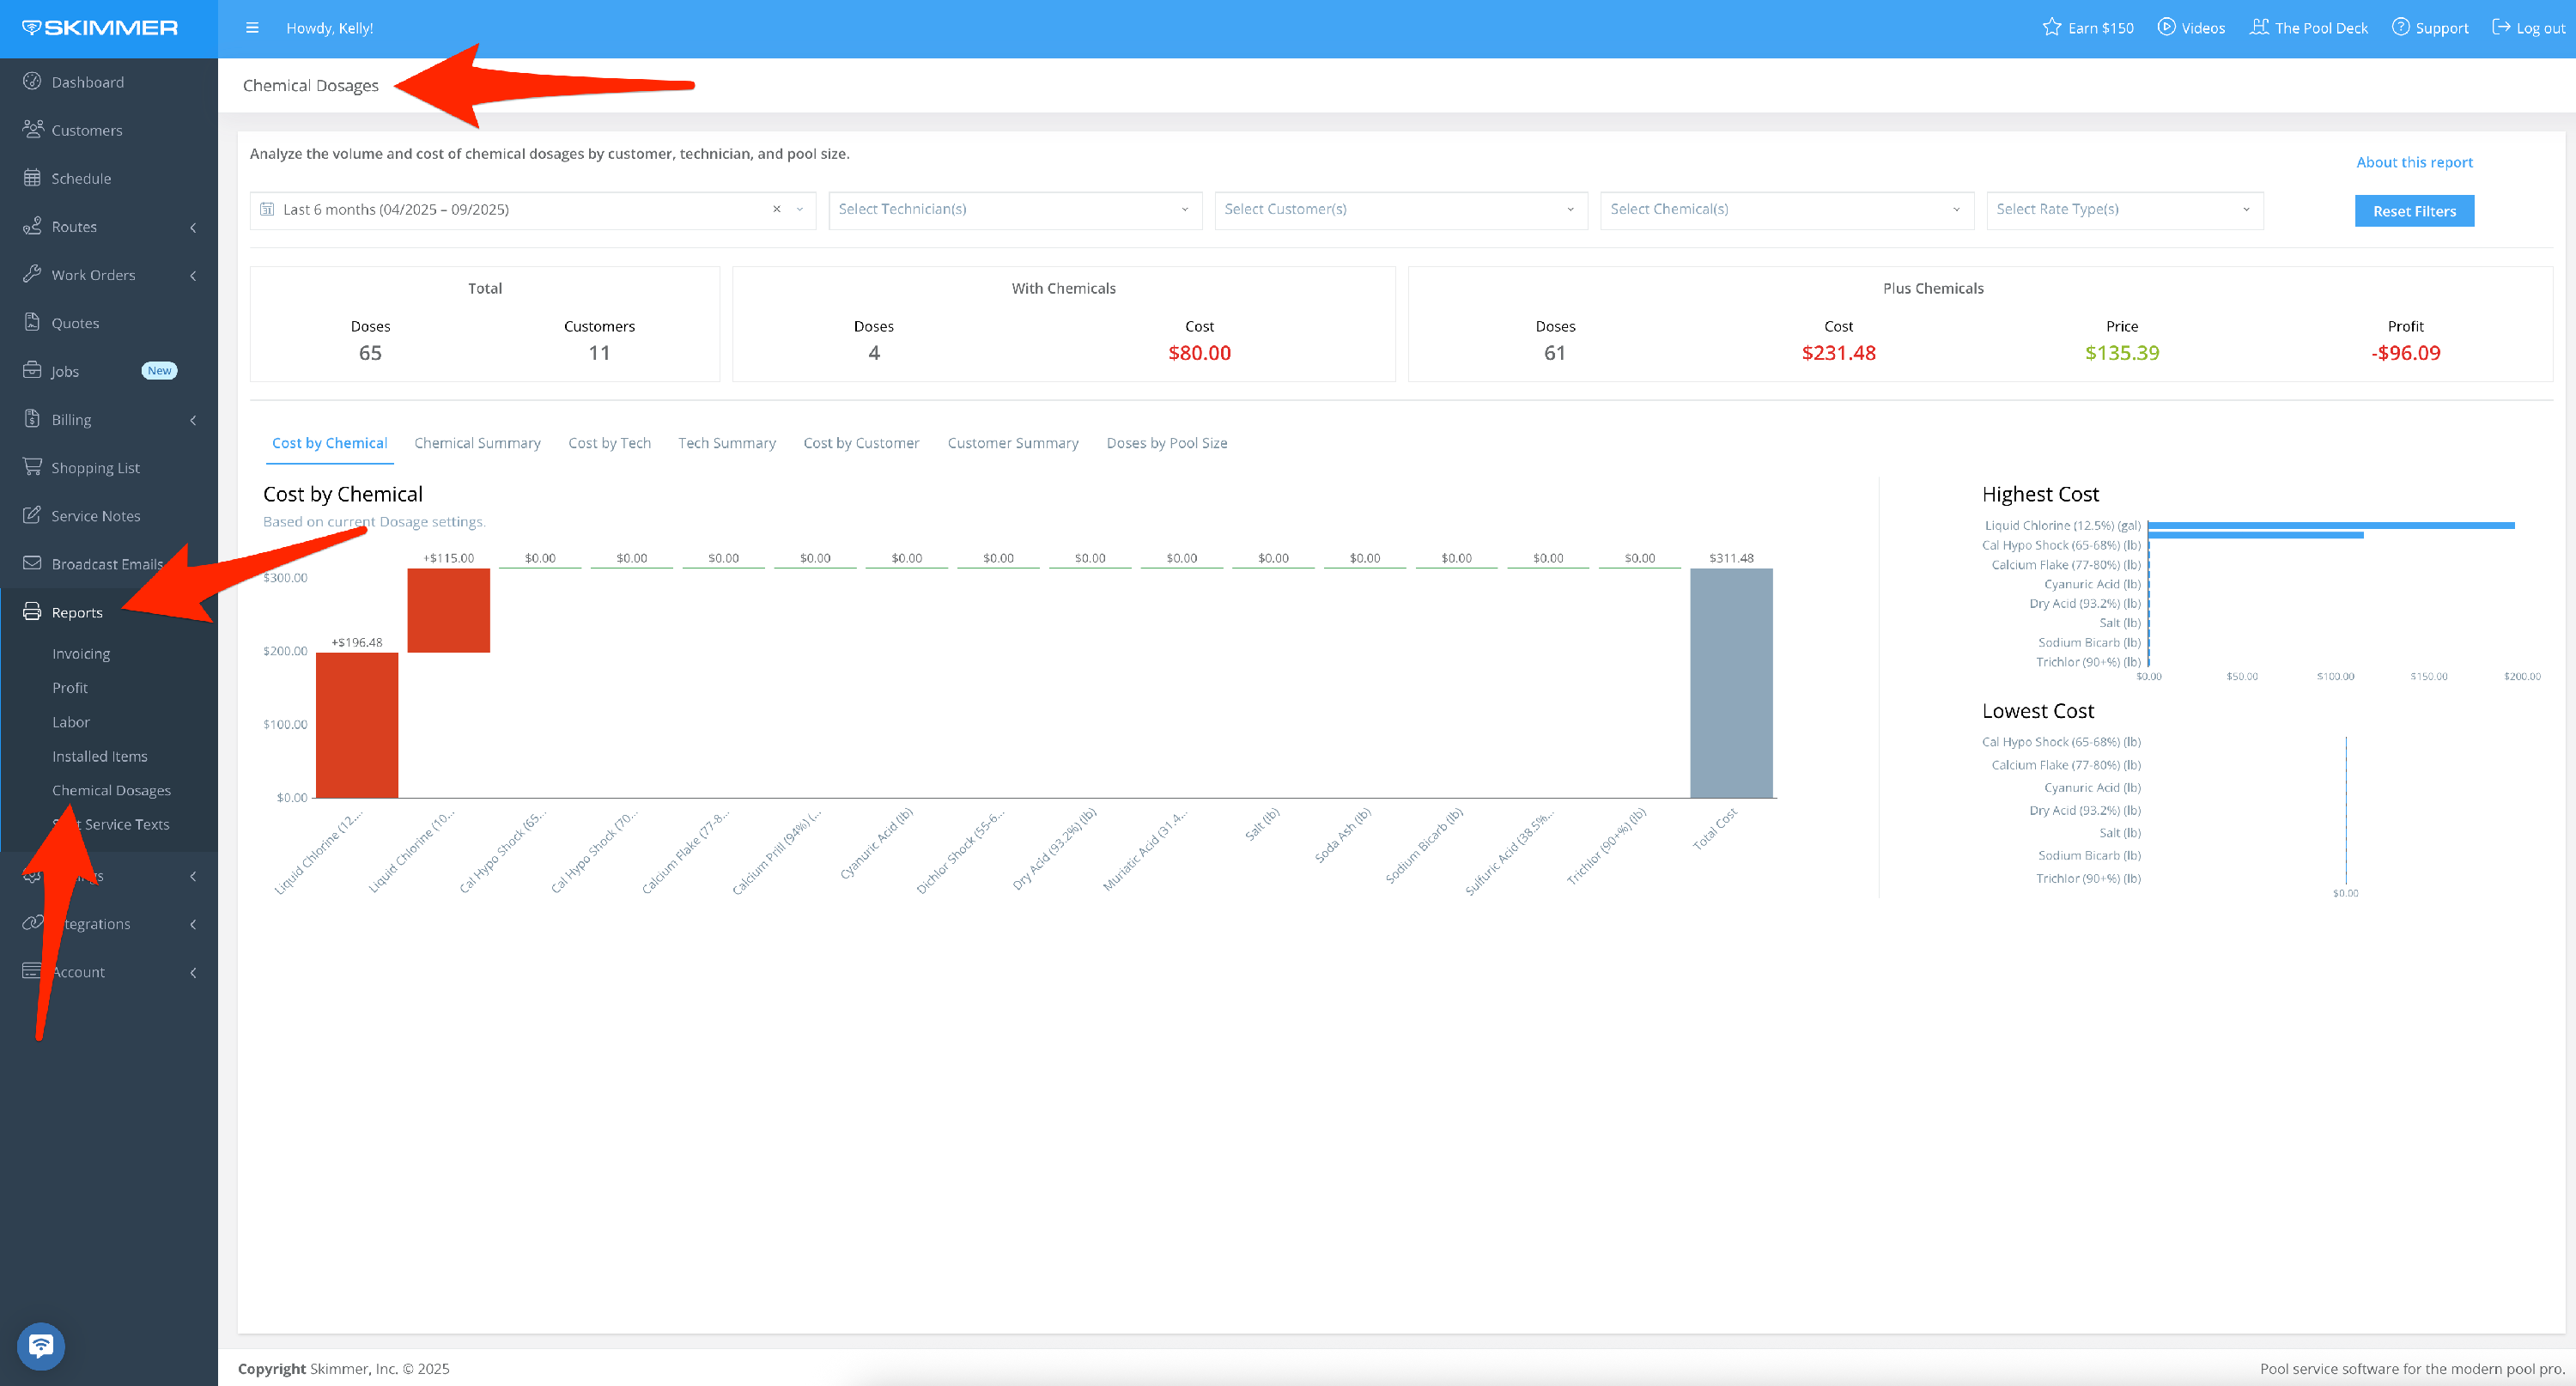
The Chemical Dosages Report displays chemical dosage volume, cost, price, and profit by customer and tech during a select date range.
Step-by-step instructions . . .
- 1
-
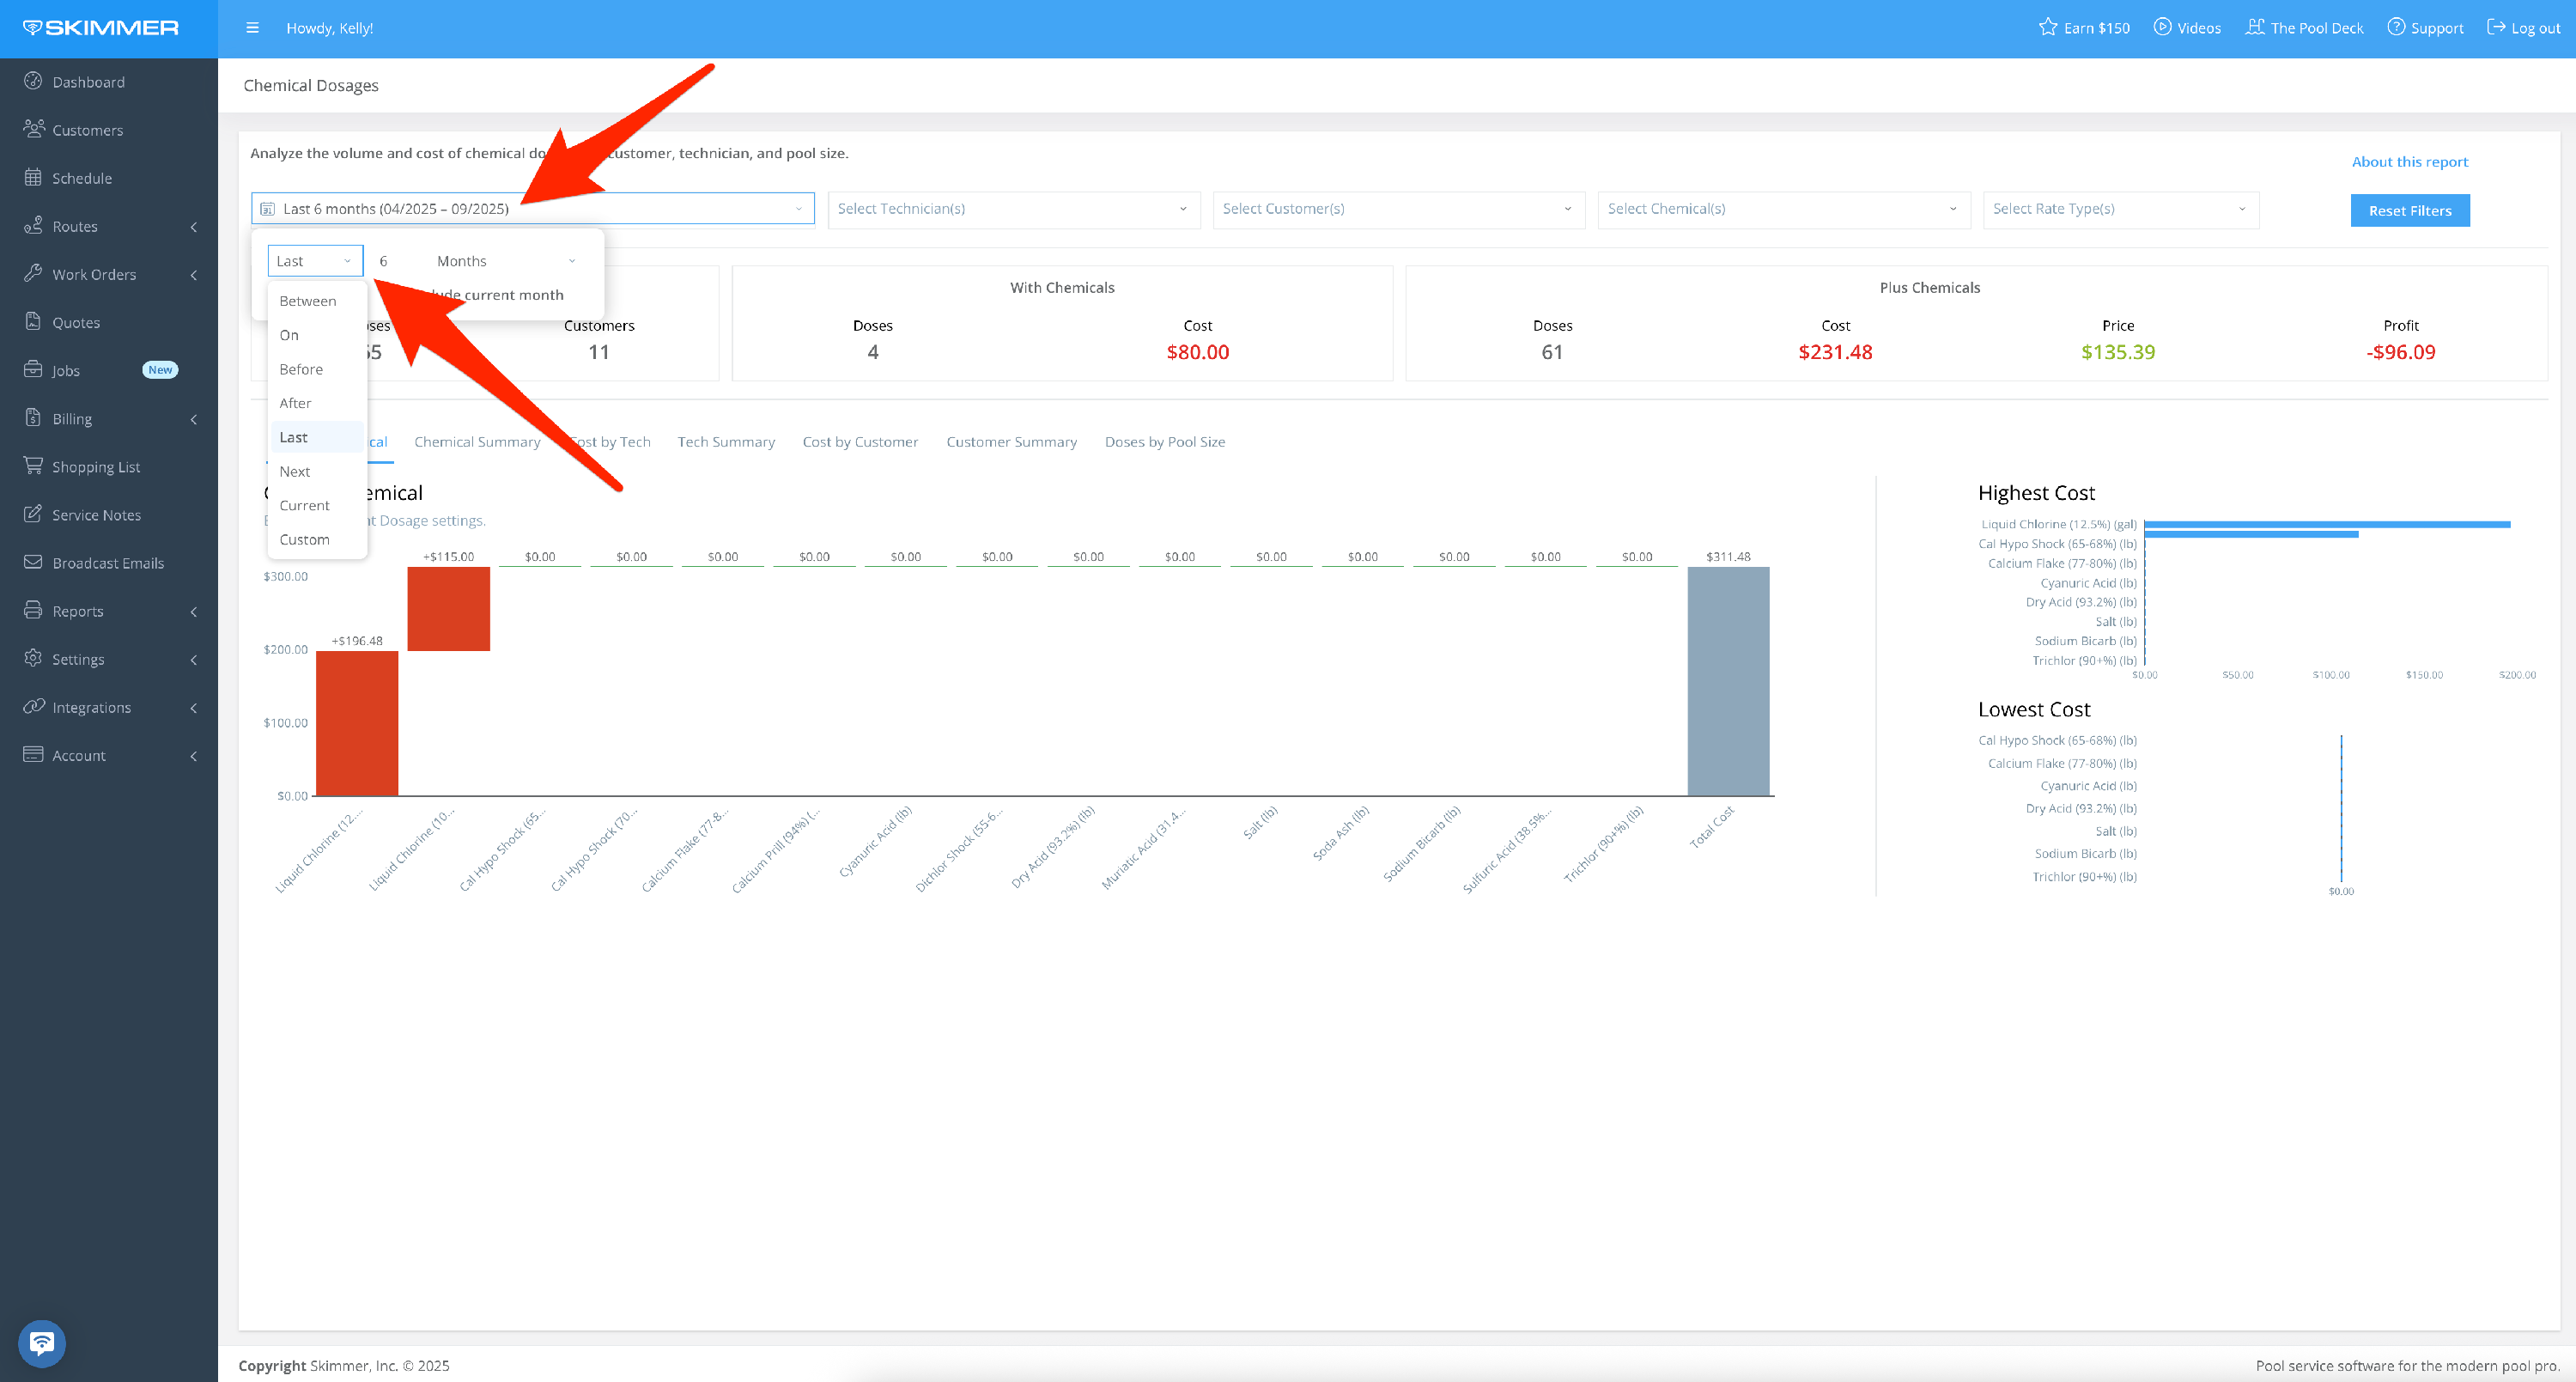
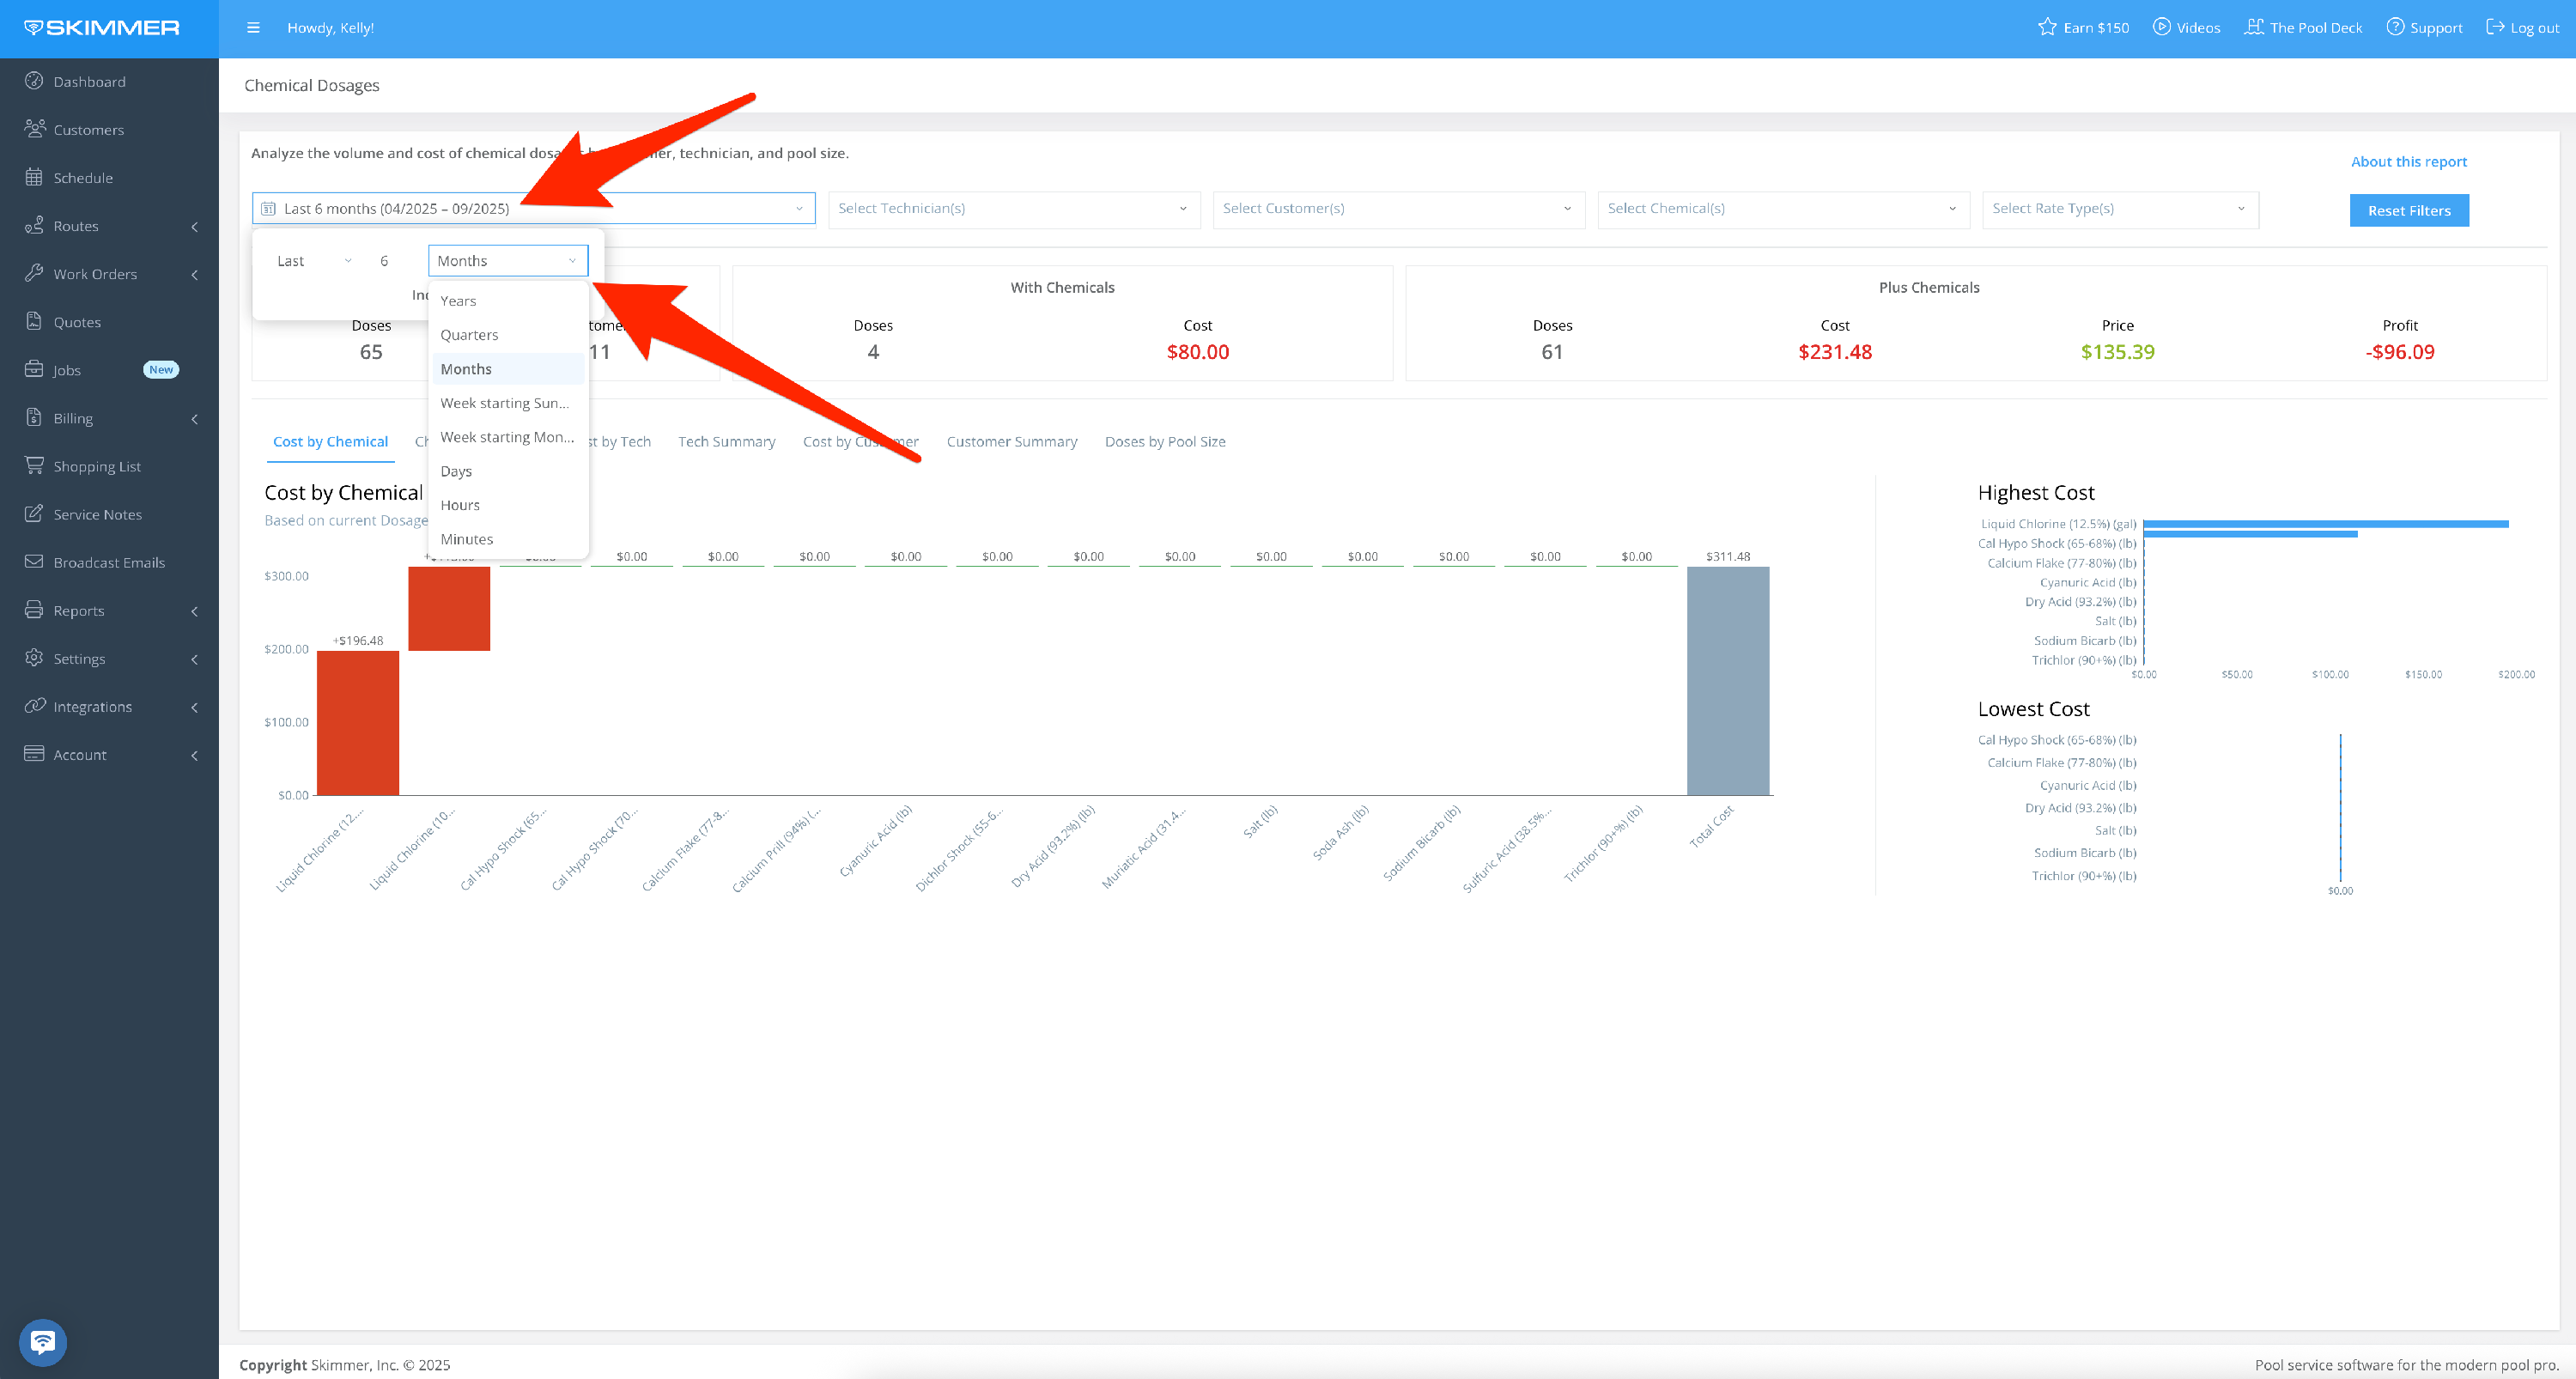
Filter by Date Range:
- Between two dates, creating a date range
- On, before, or after a specific date
- Last sets a time frame going into the past–last day/week/six months/two years, etc. even last hours or minutes, fully customizable
- Current lets you center on now and view by current hour/day/month/quarter, and more
- The Next option does not currently have information associated with it, so you won’t need to select it.
- 2
-
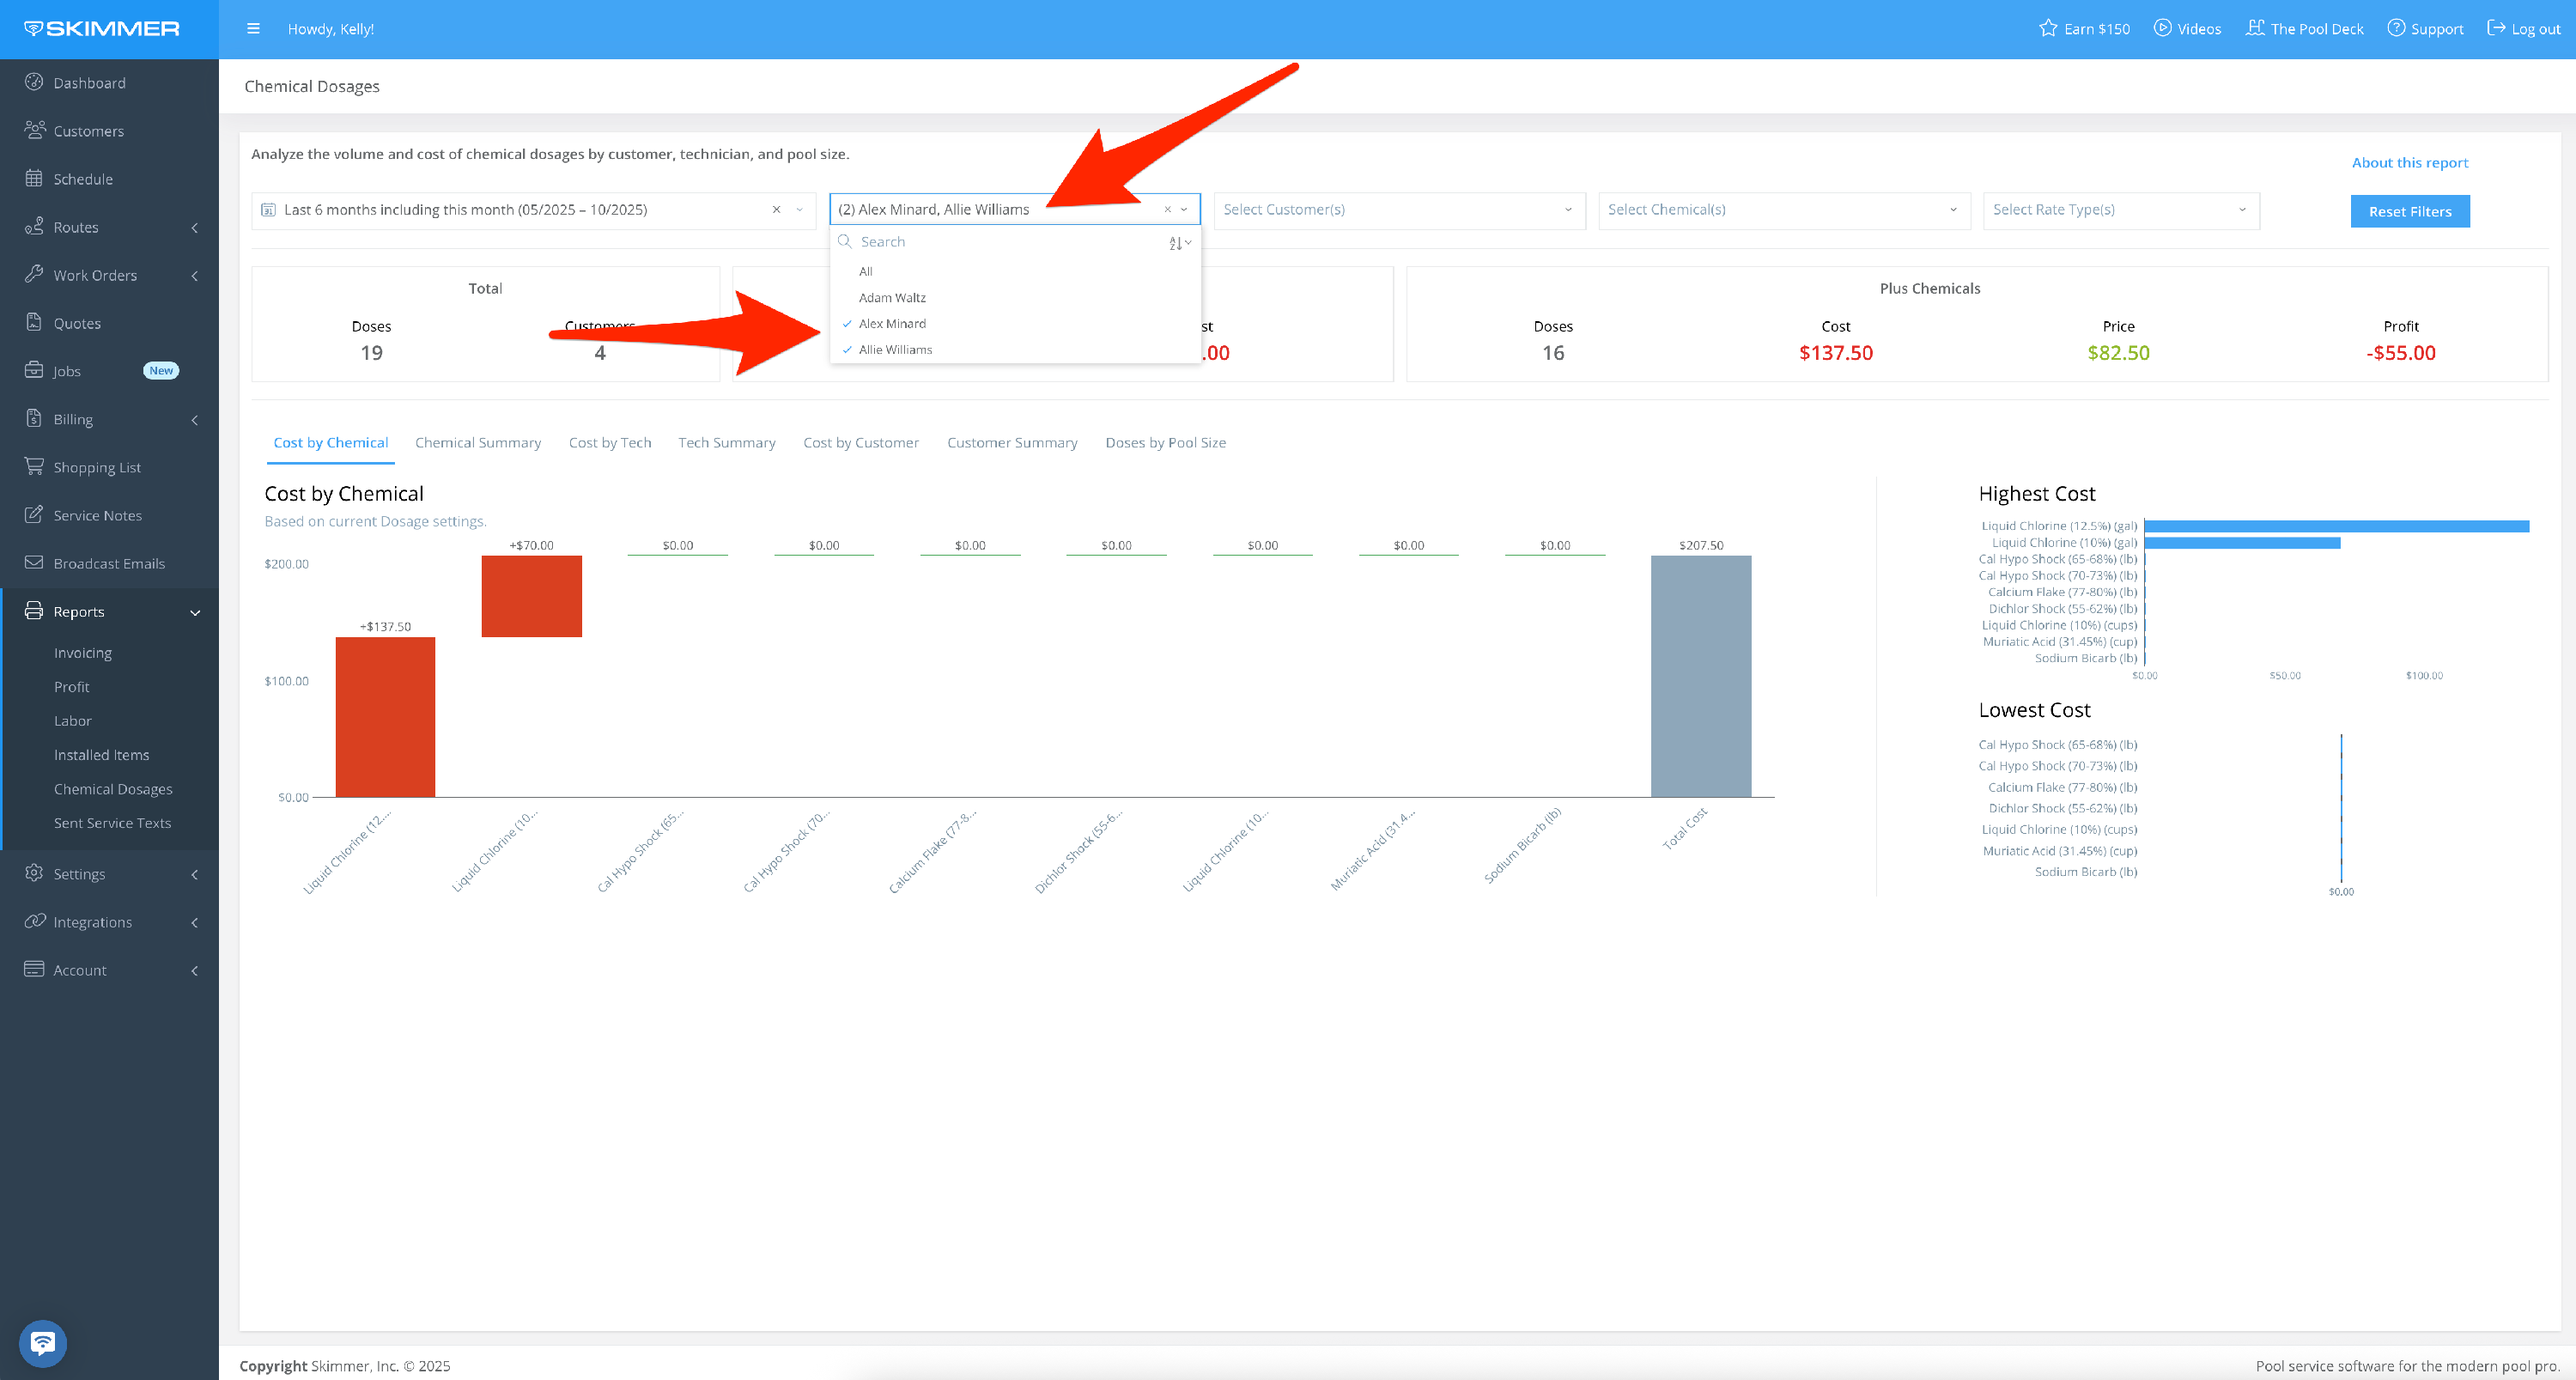
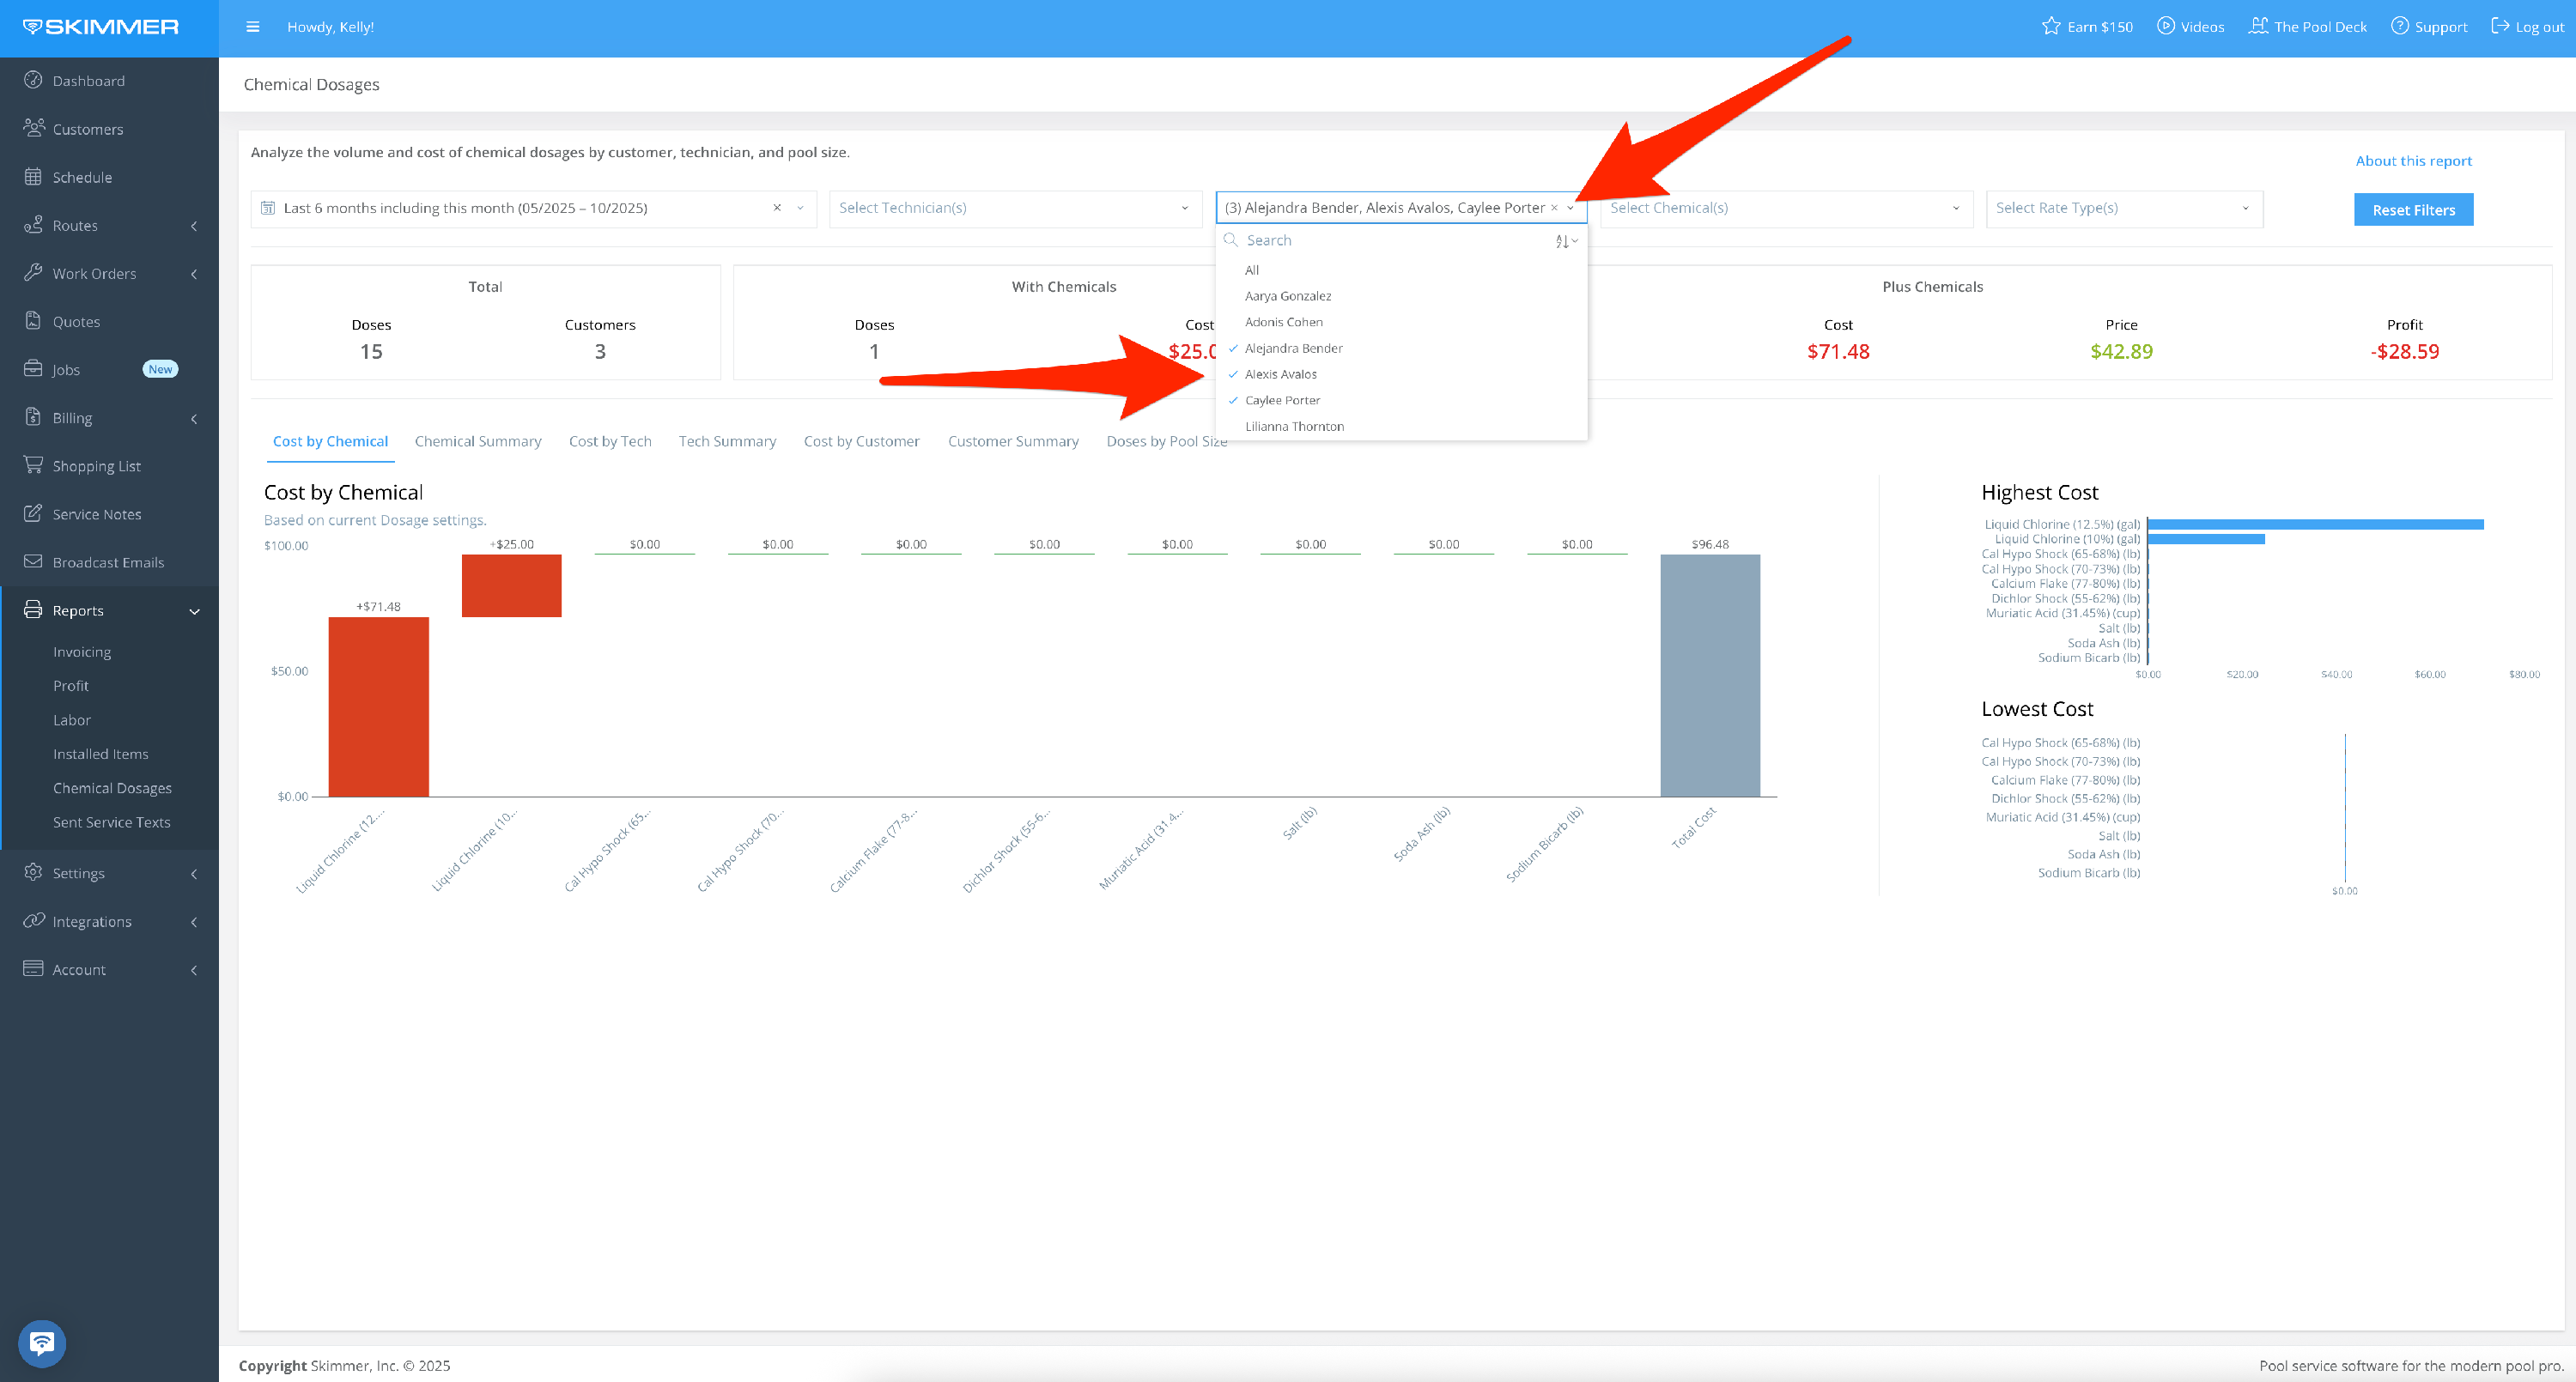
Filter by Technician:
Display dosages and related service information by one tech, or a select set of techs. When you filter by tech, the only names that show up in the dropdown are the ones who have performed service within the selected time frame.
- 3
-
Filter by Customer:
- By customer name
- By multiple customers based on check boxes
- Make your choices and the list filters down, showing the same information as full list for the selected customers
- When you filter by customer, the only customer names that show up in the dropdown are the ones who have received service within the selected time frame
- 4
-
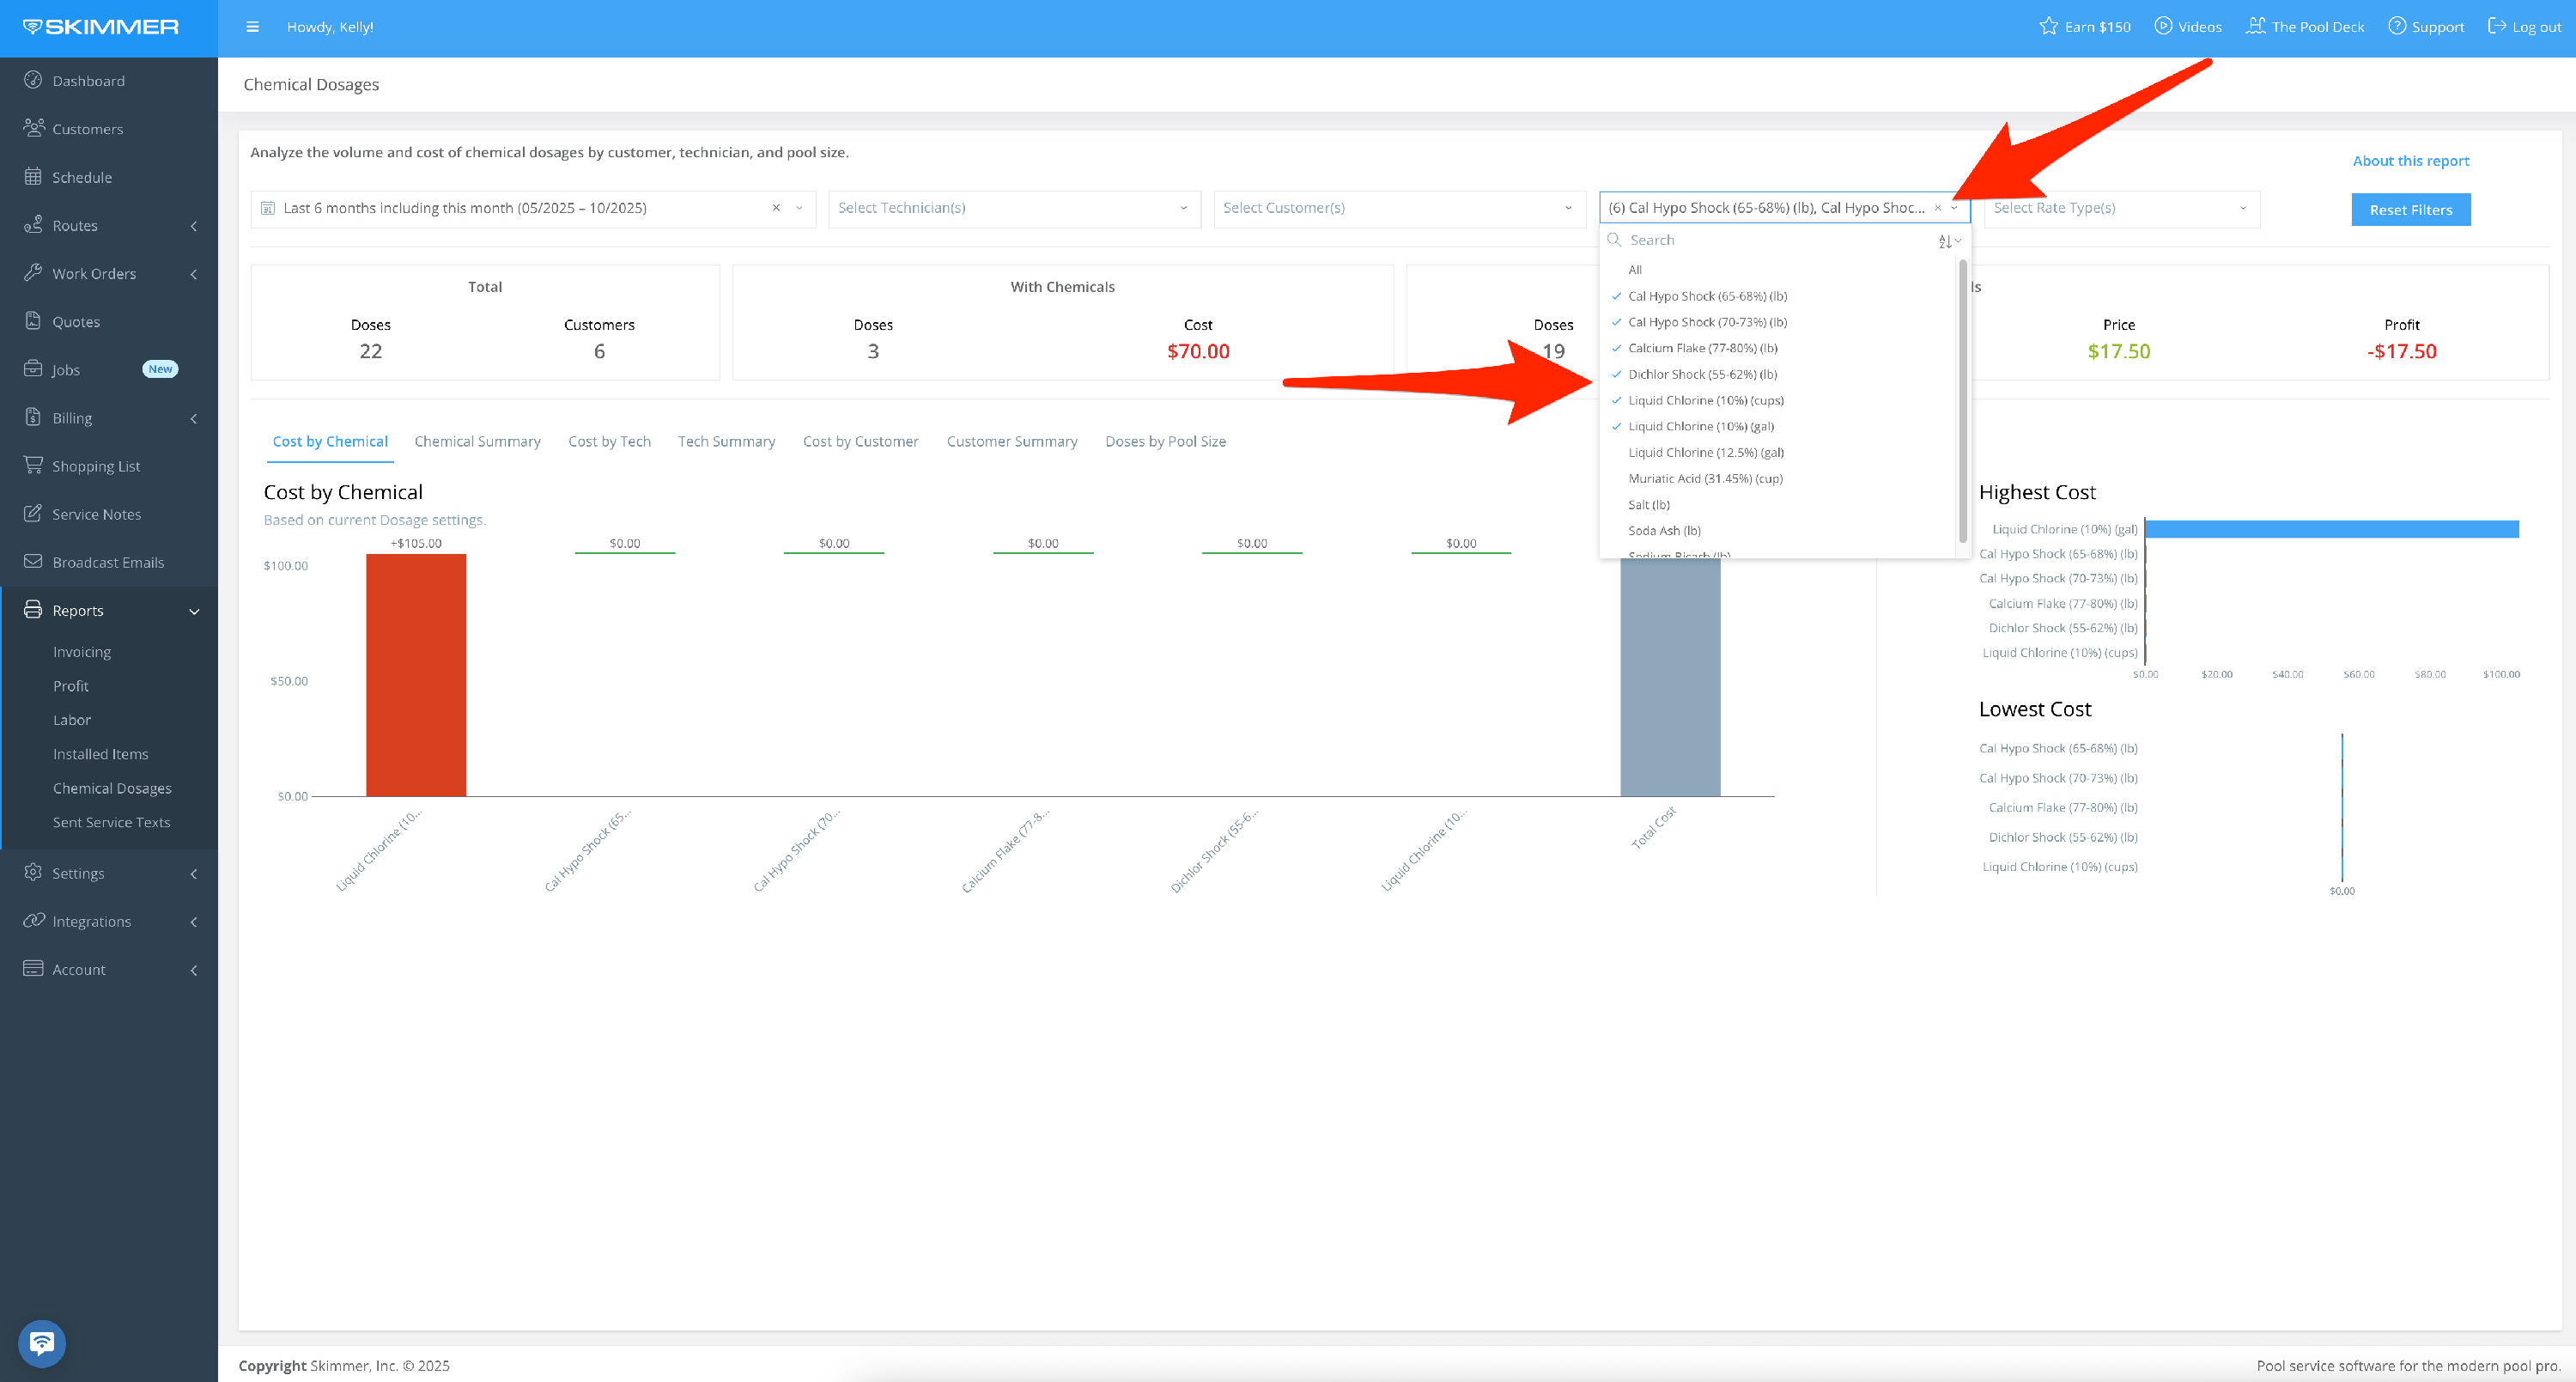
Filter by Chemicals:
Select specific chemicals for which you want to display dosage information.
- 5
-
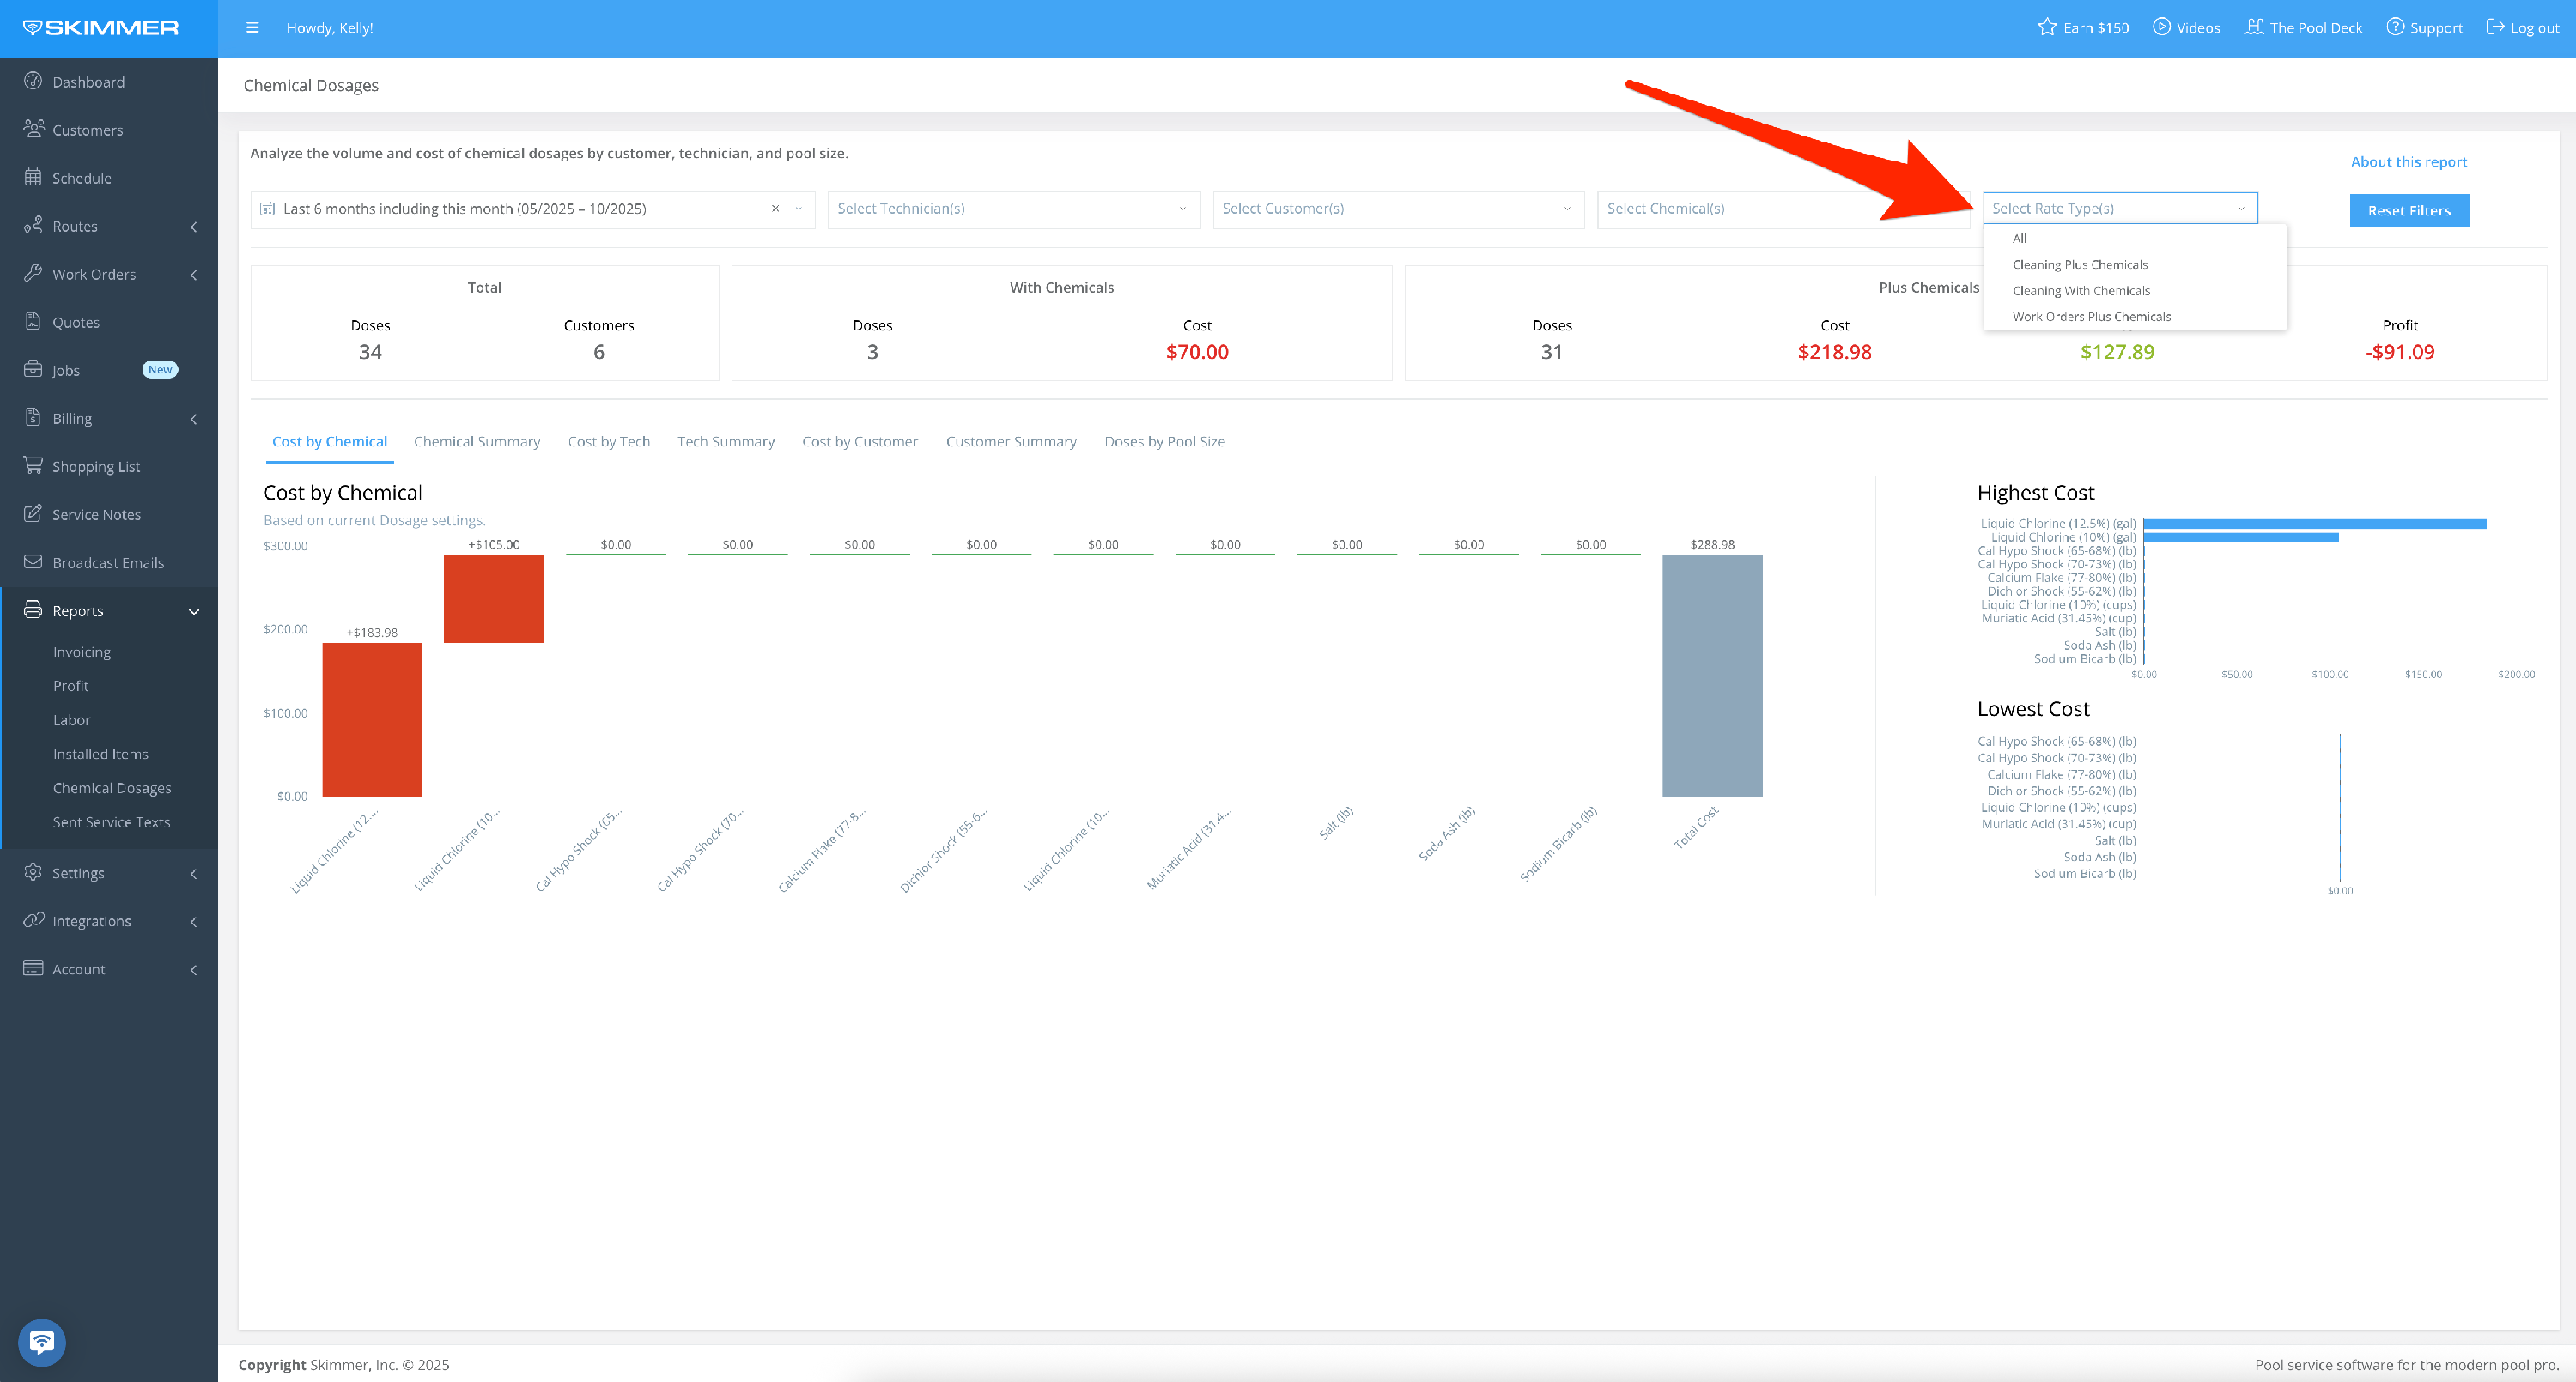
Filter by Rate Type:
- View dosages based on how you charge customers
- This report includes work orders, and you can filter to see only those profits
- 6
-
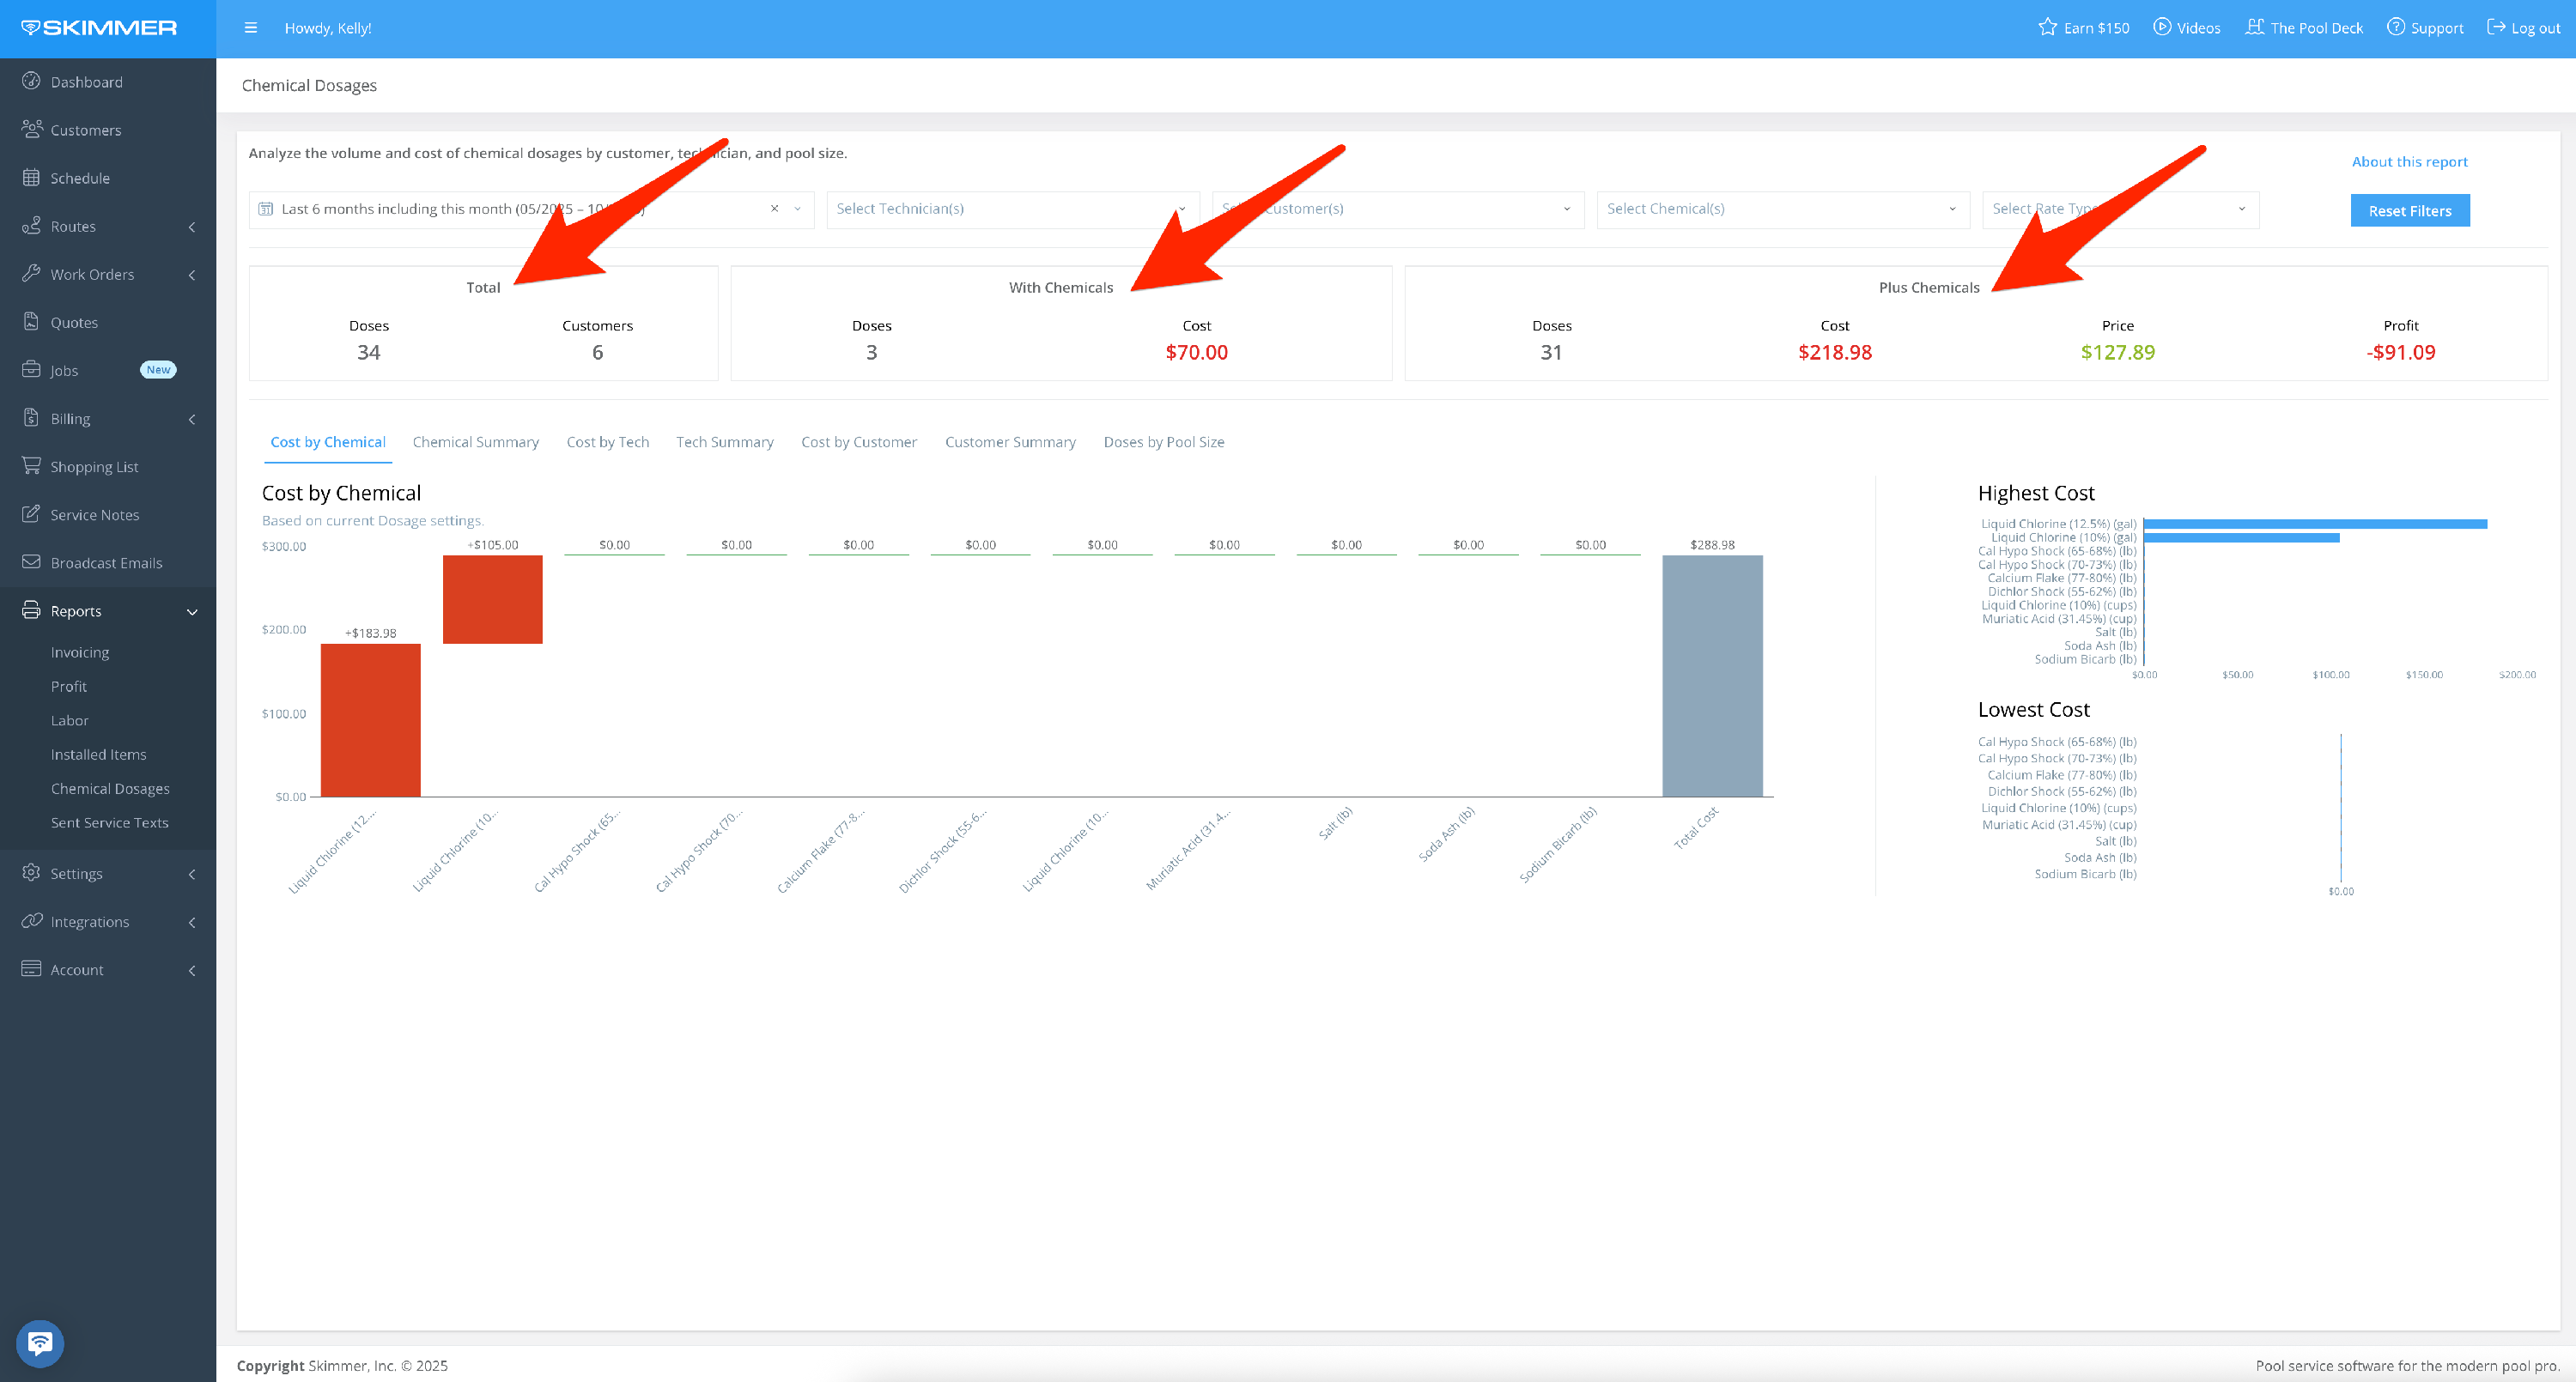
What you choose for filters will reflect in the following areas:
First area gives you headline metrics, the total chemical doses and customers serviced, and a breakdown of that basic information by rate type.
- 7
-
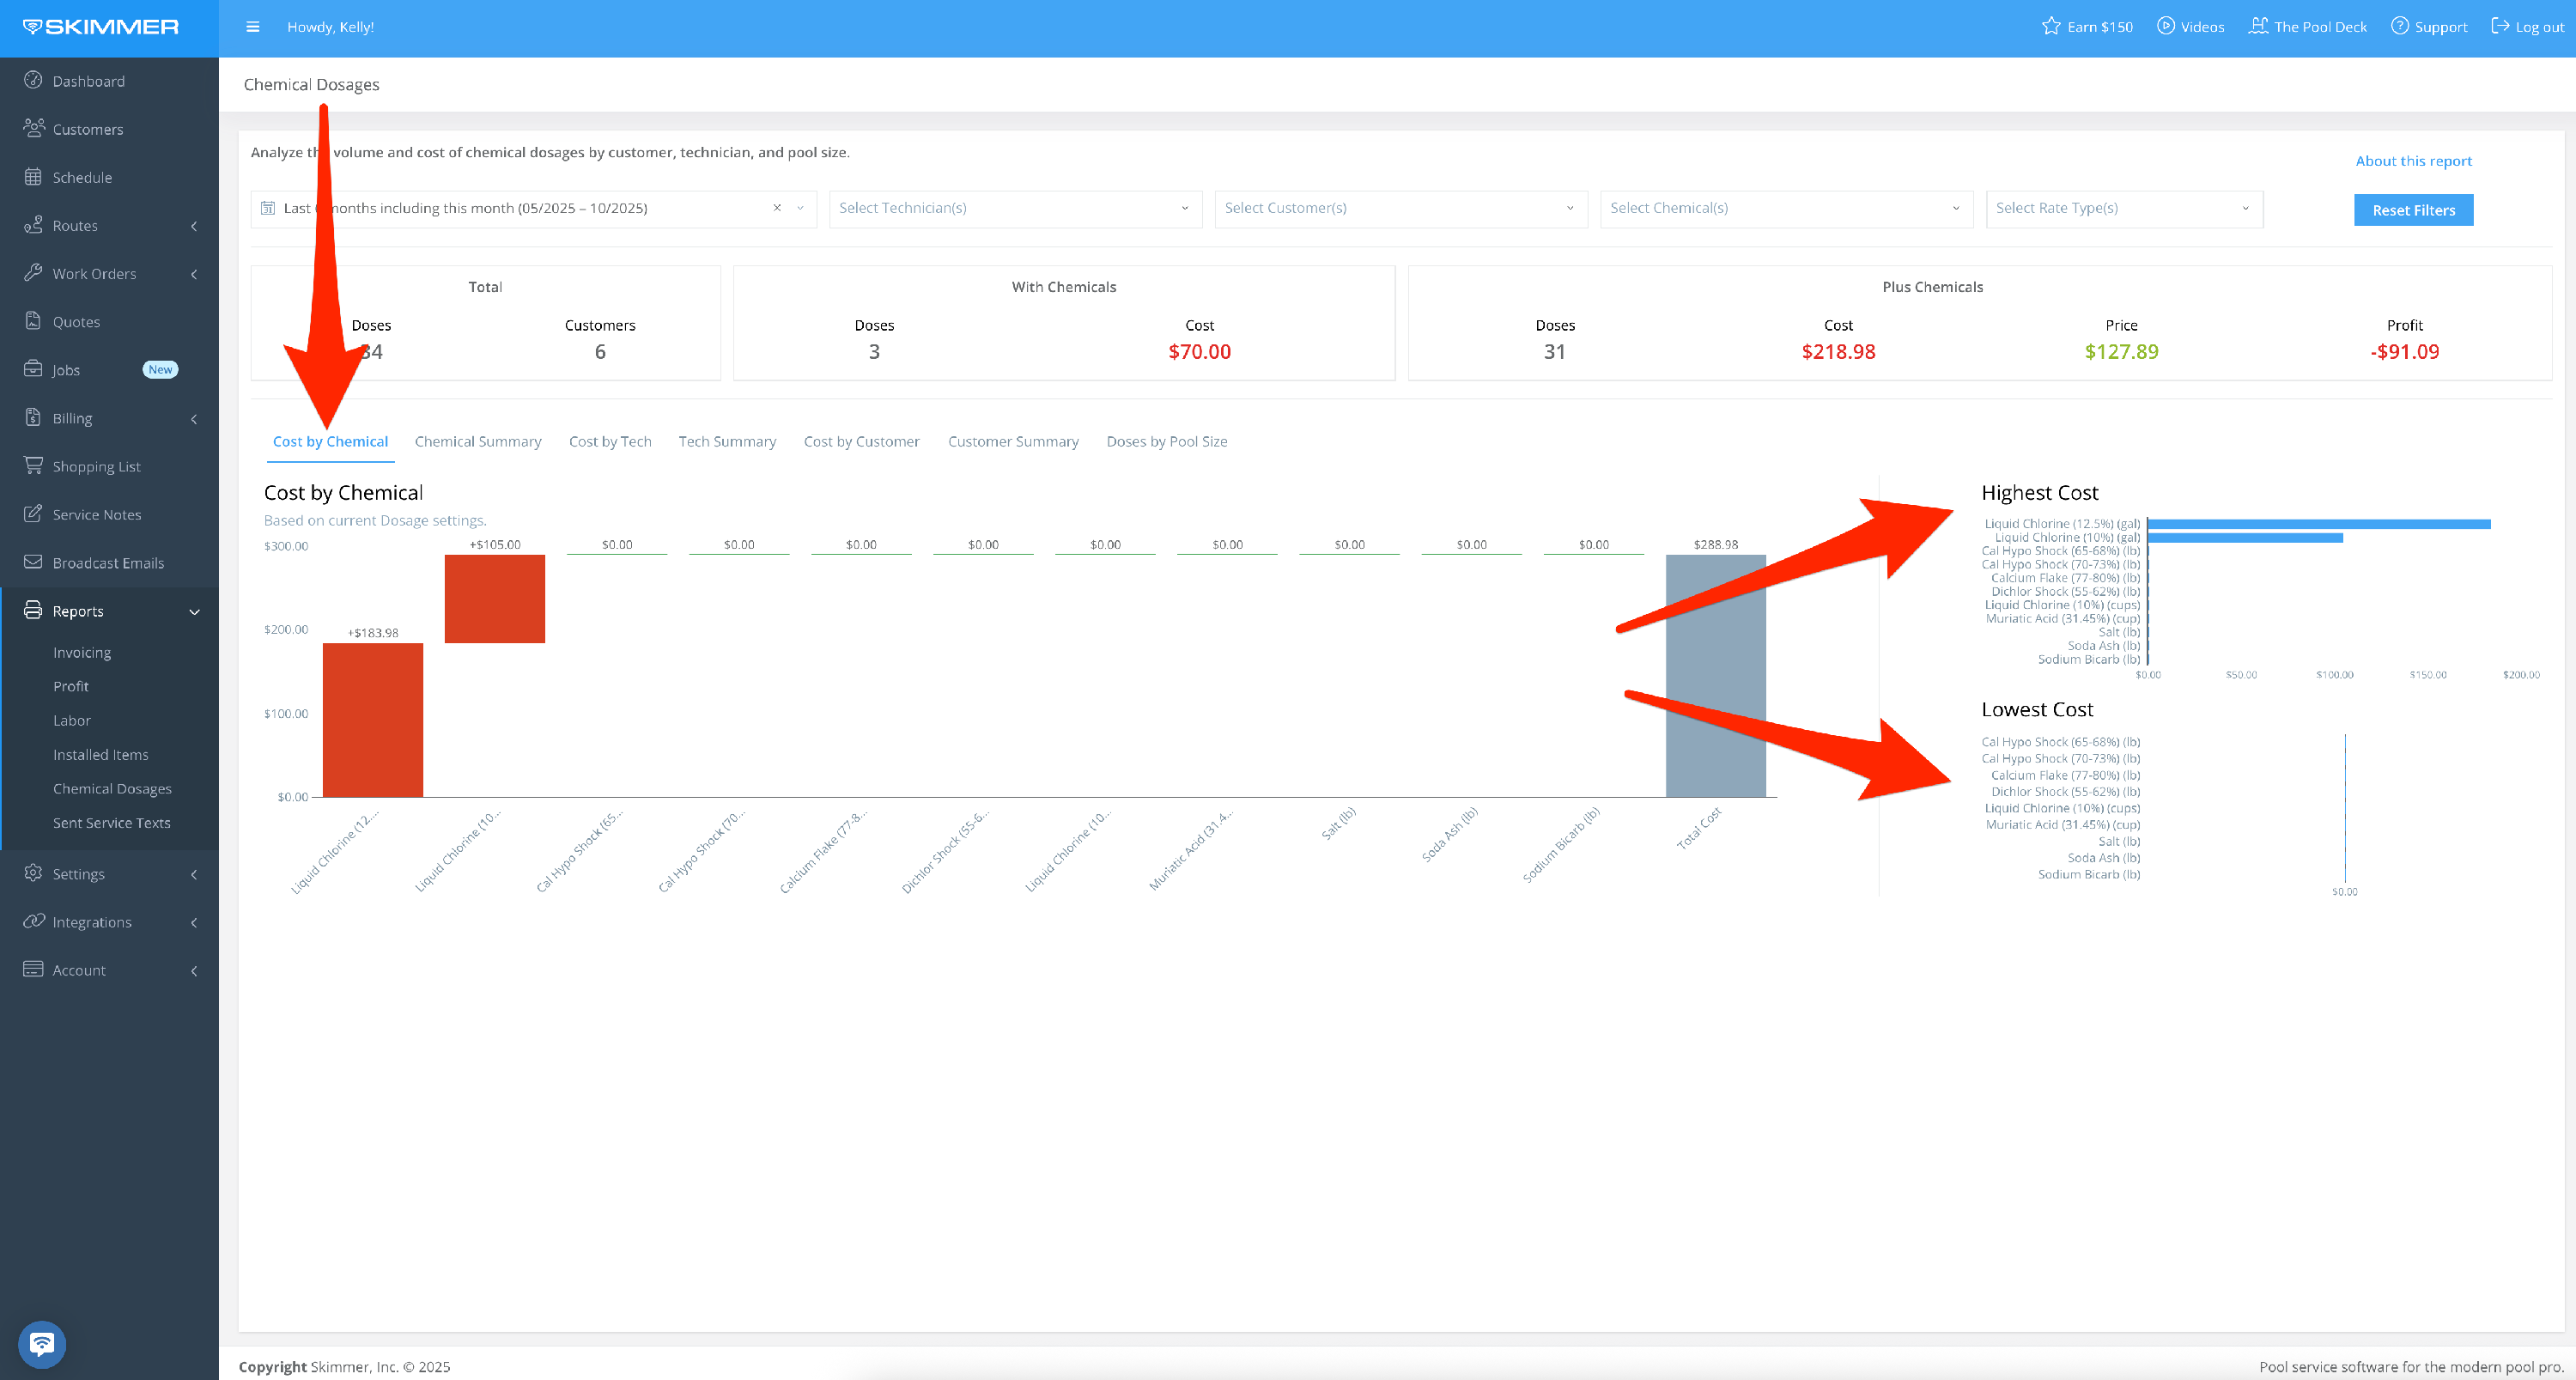
The second area gives you charts to help visualize the information.
- Cost by Chemical shows all chemicals administered during a set date range and their cost, and a quick view of the highest and lowest cost chemicals.
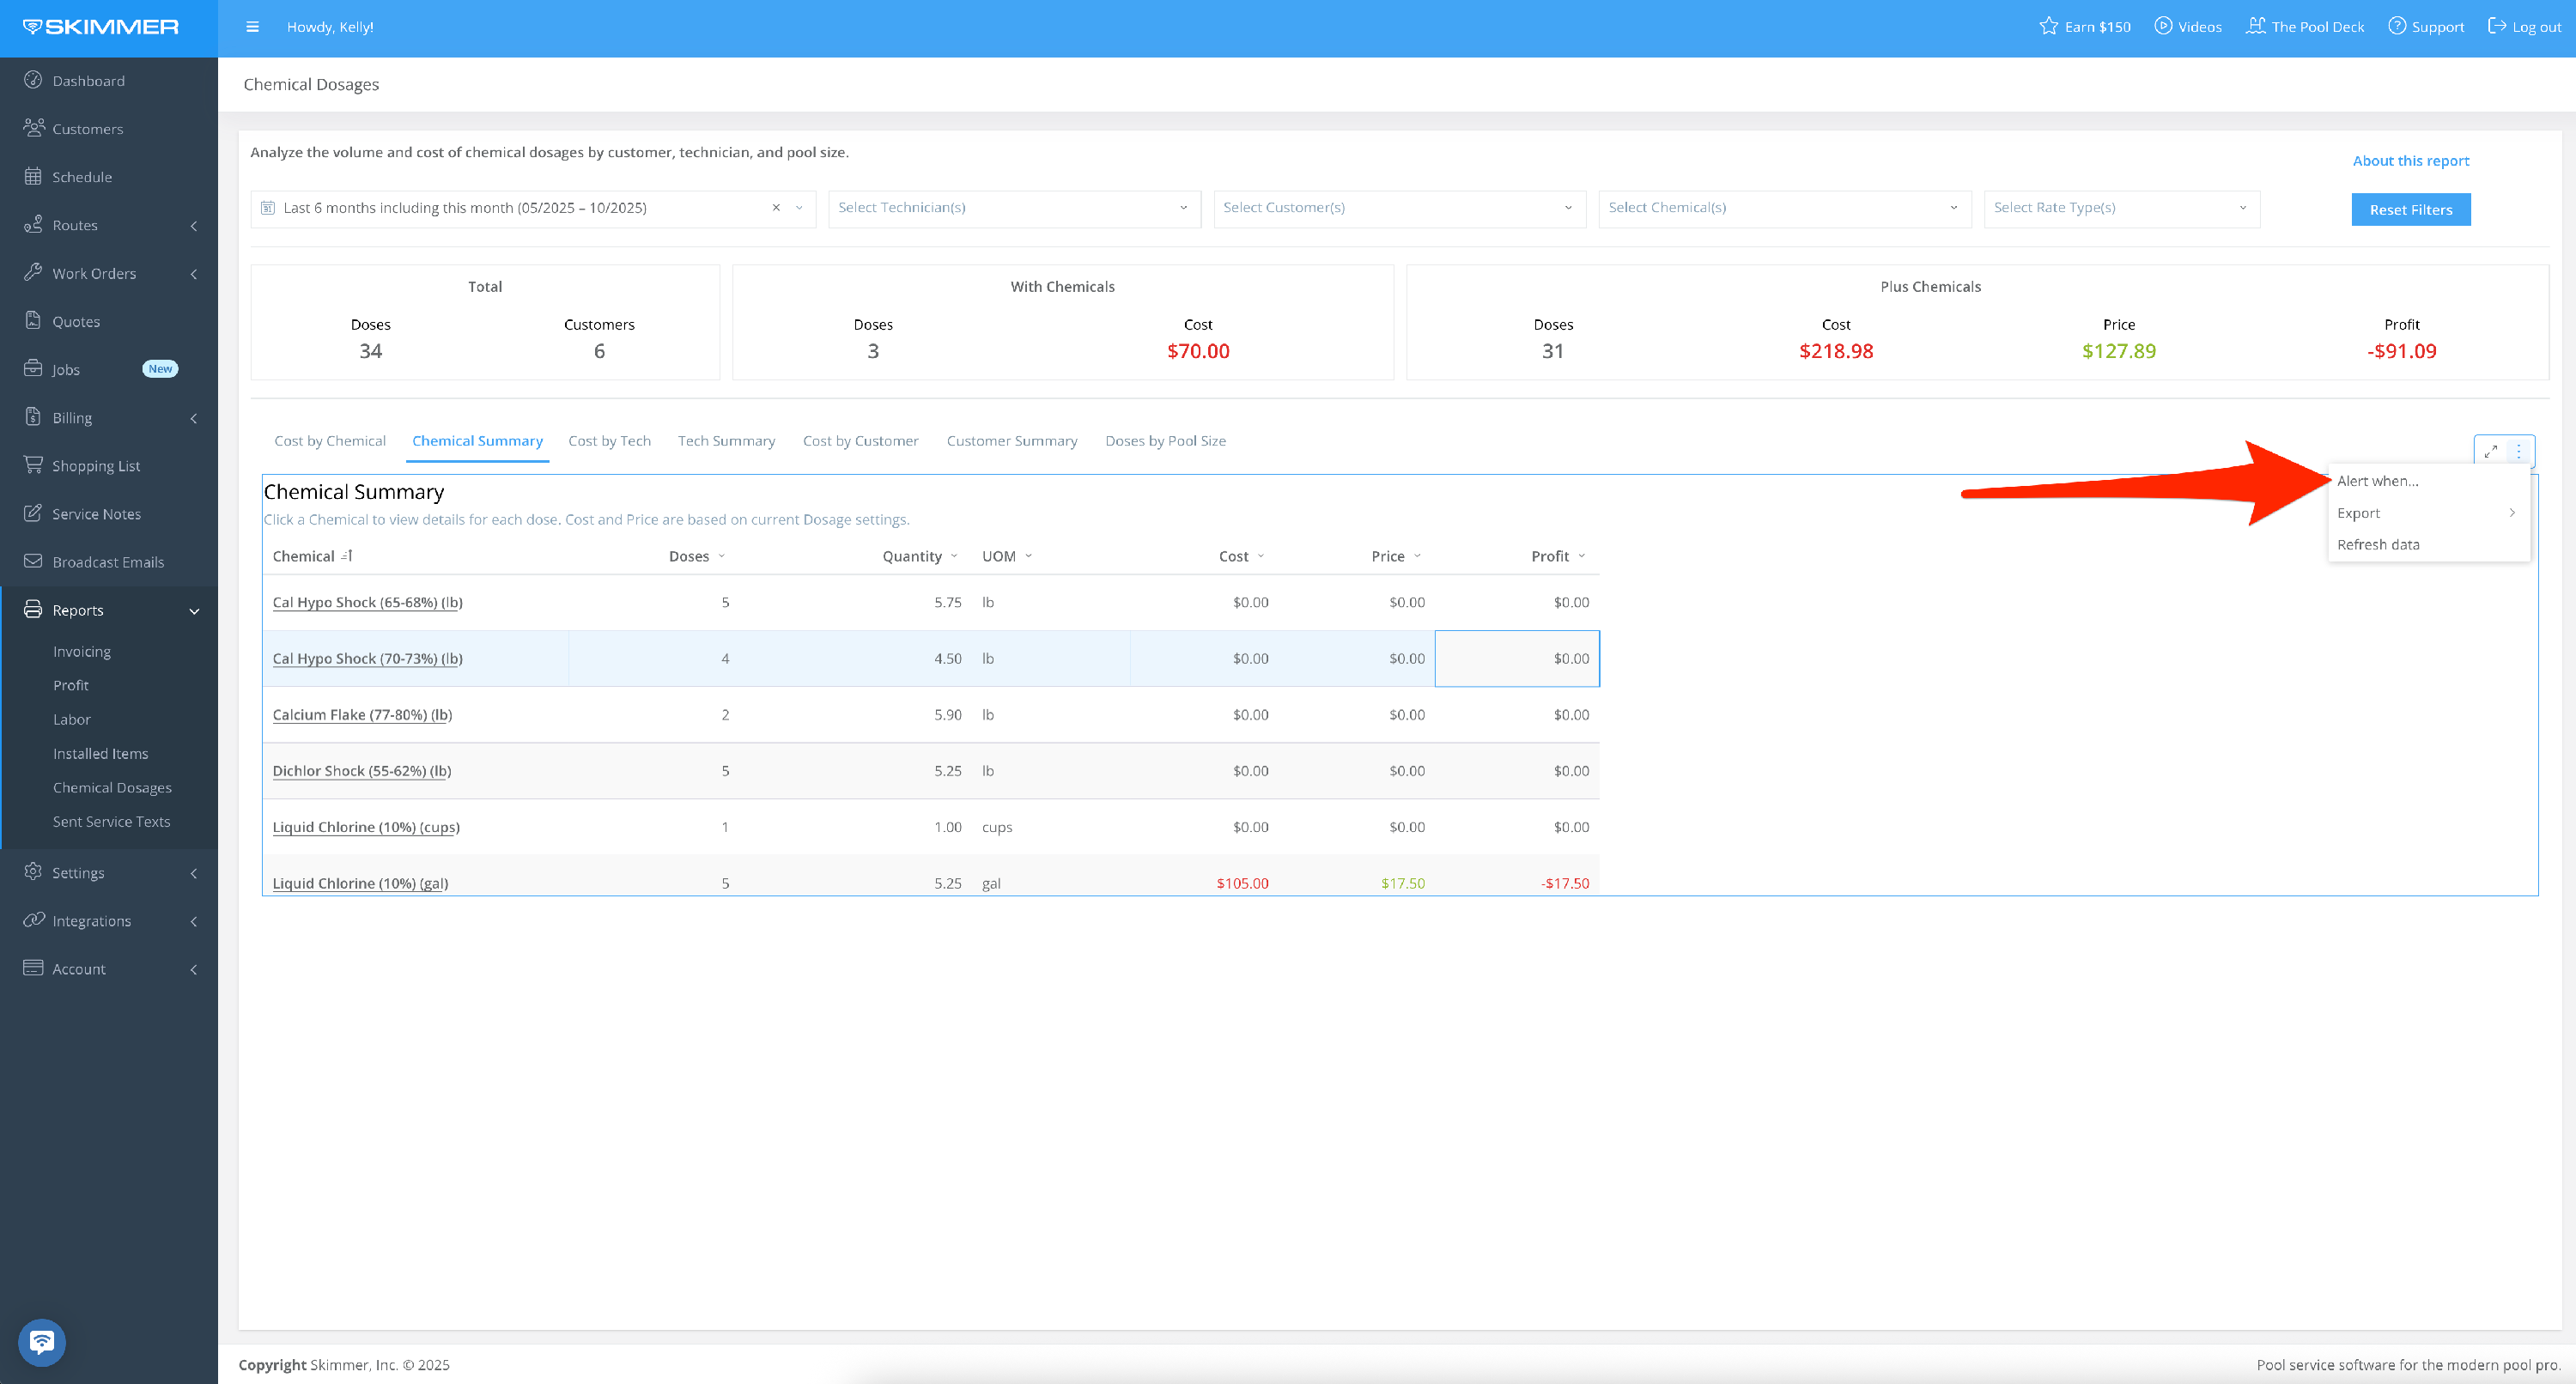
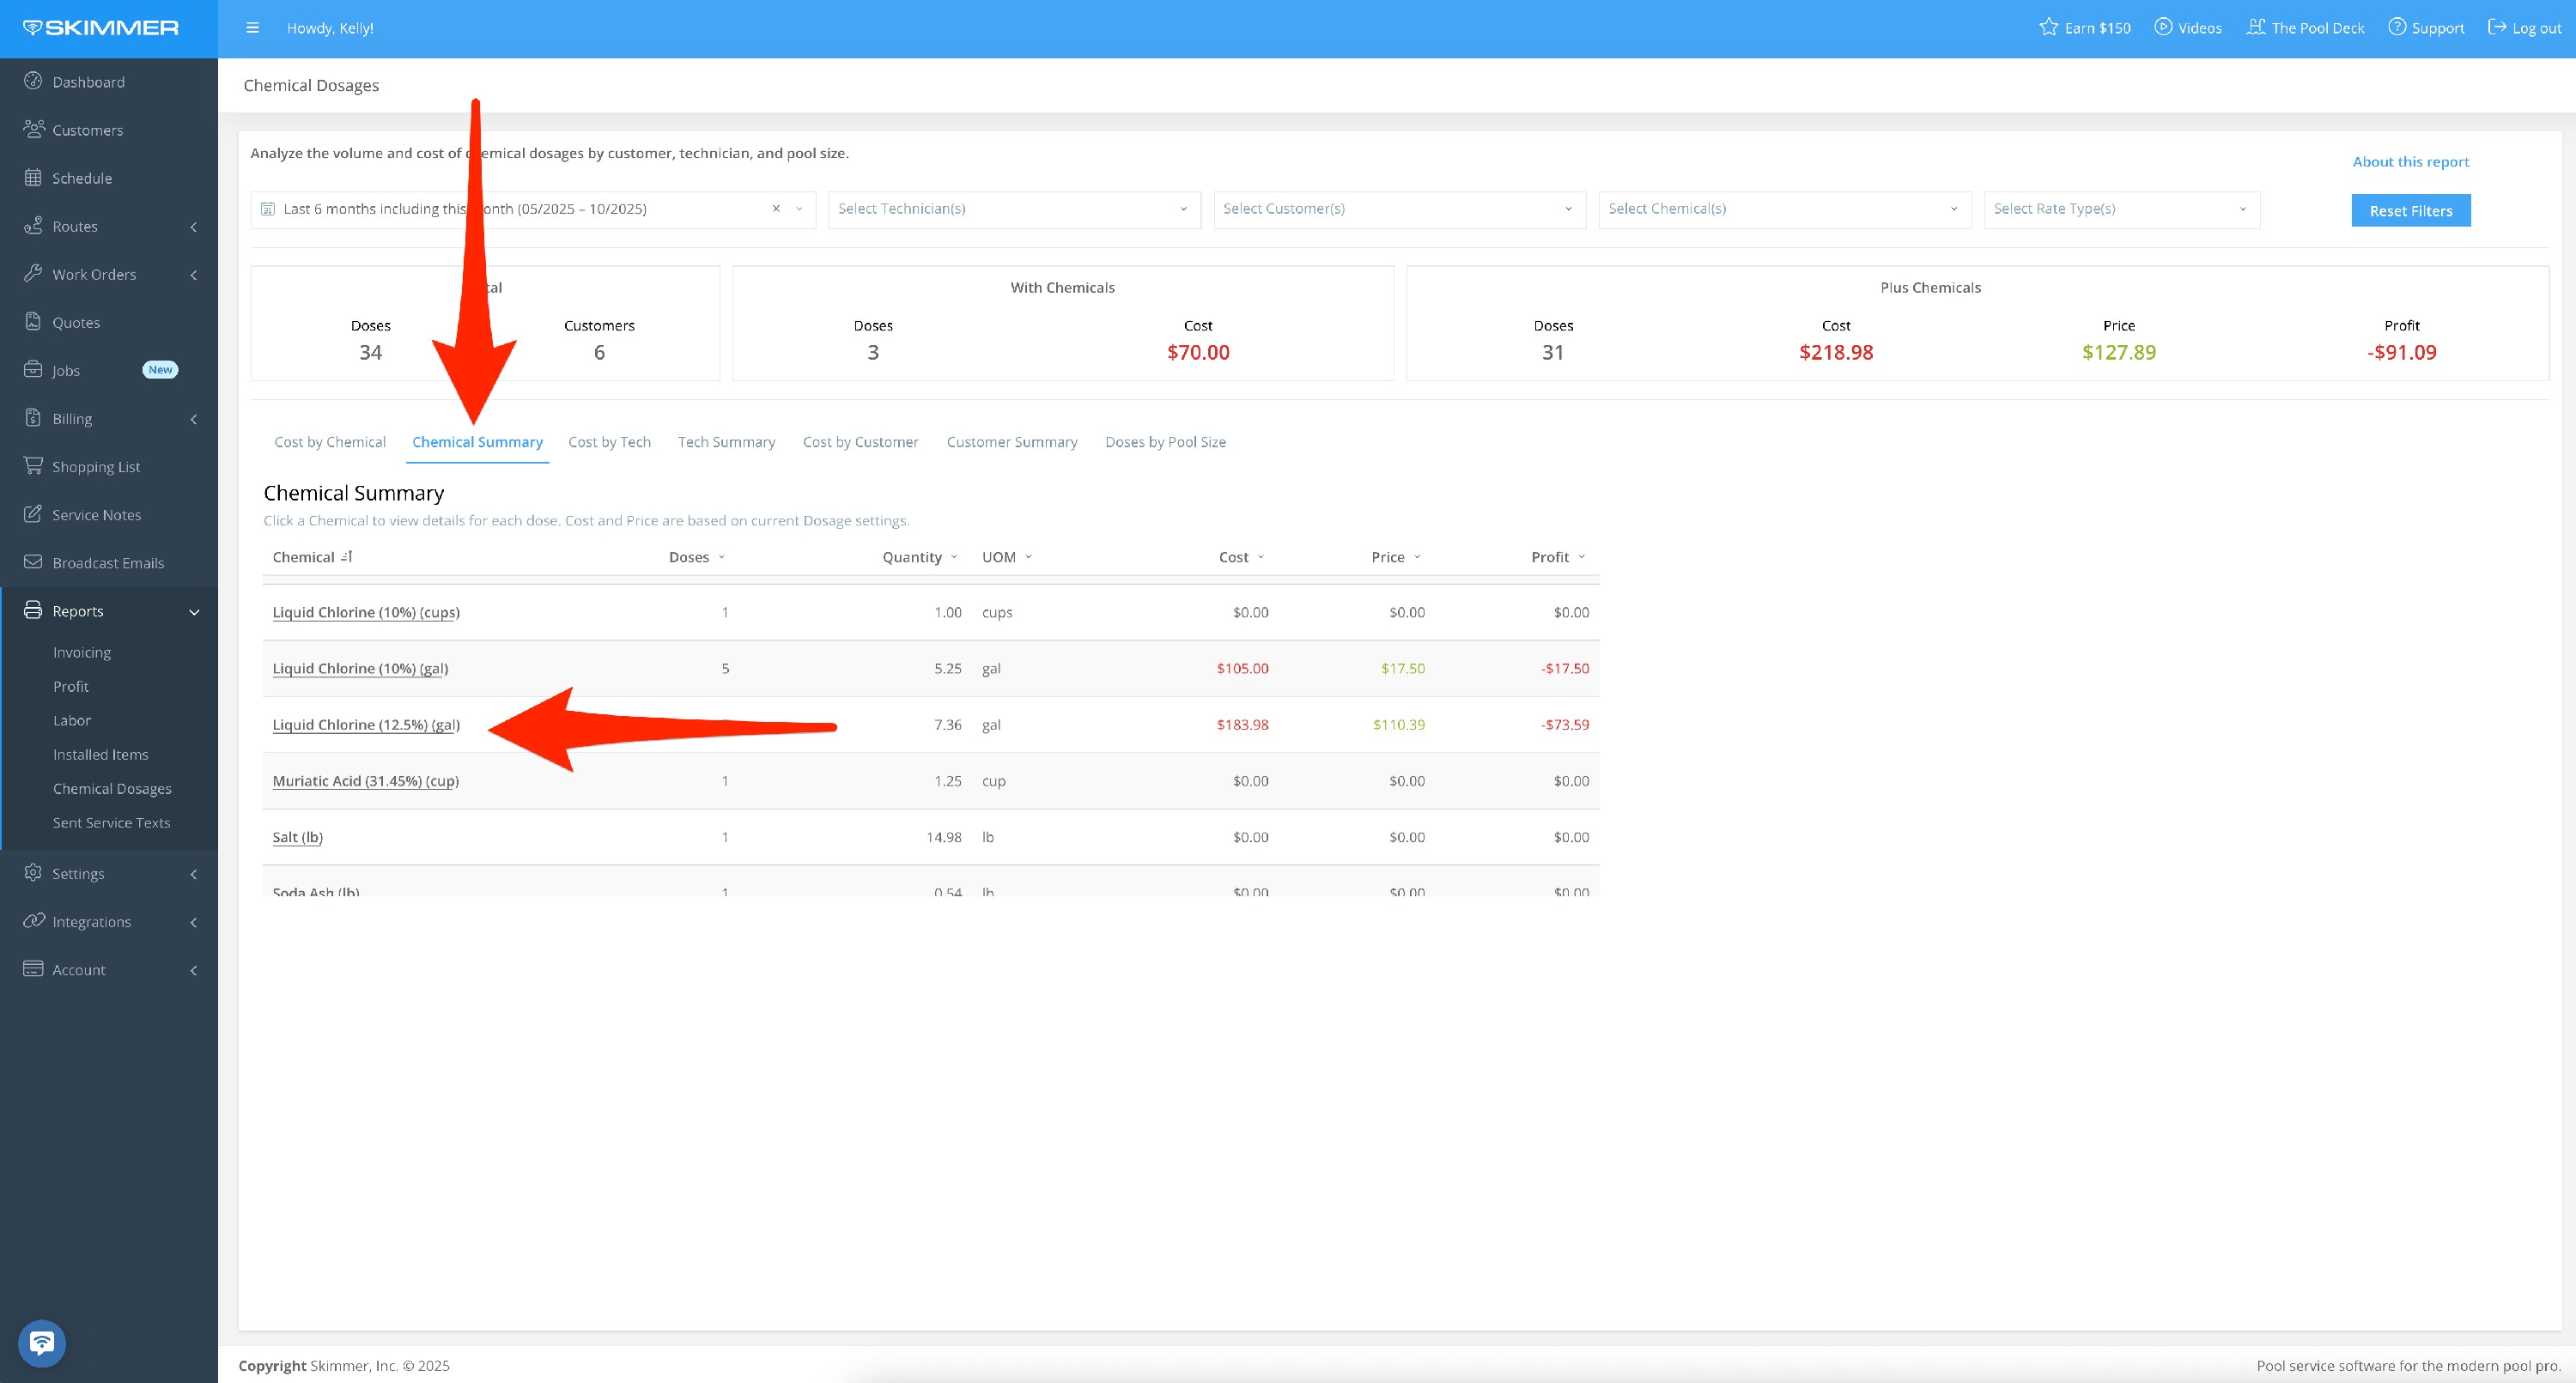
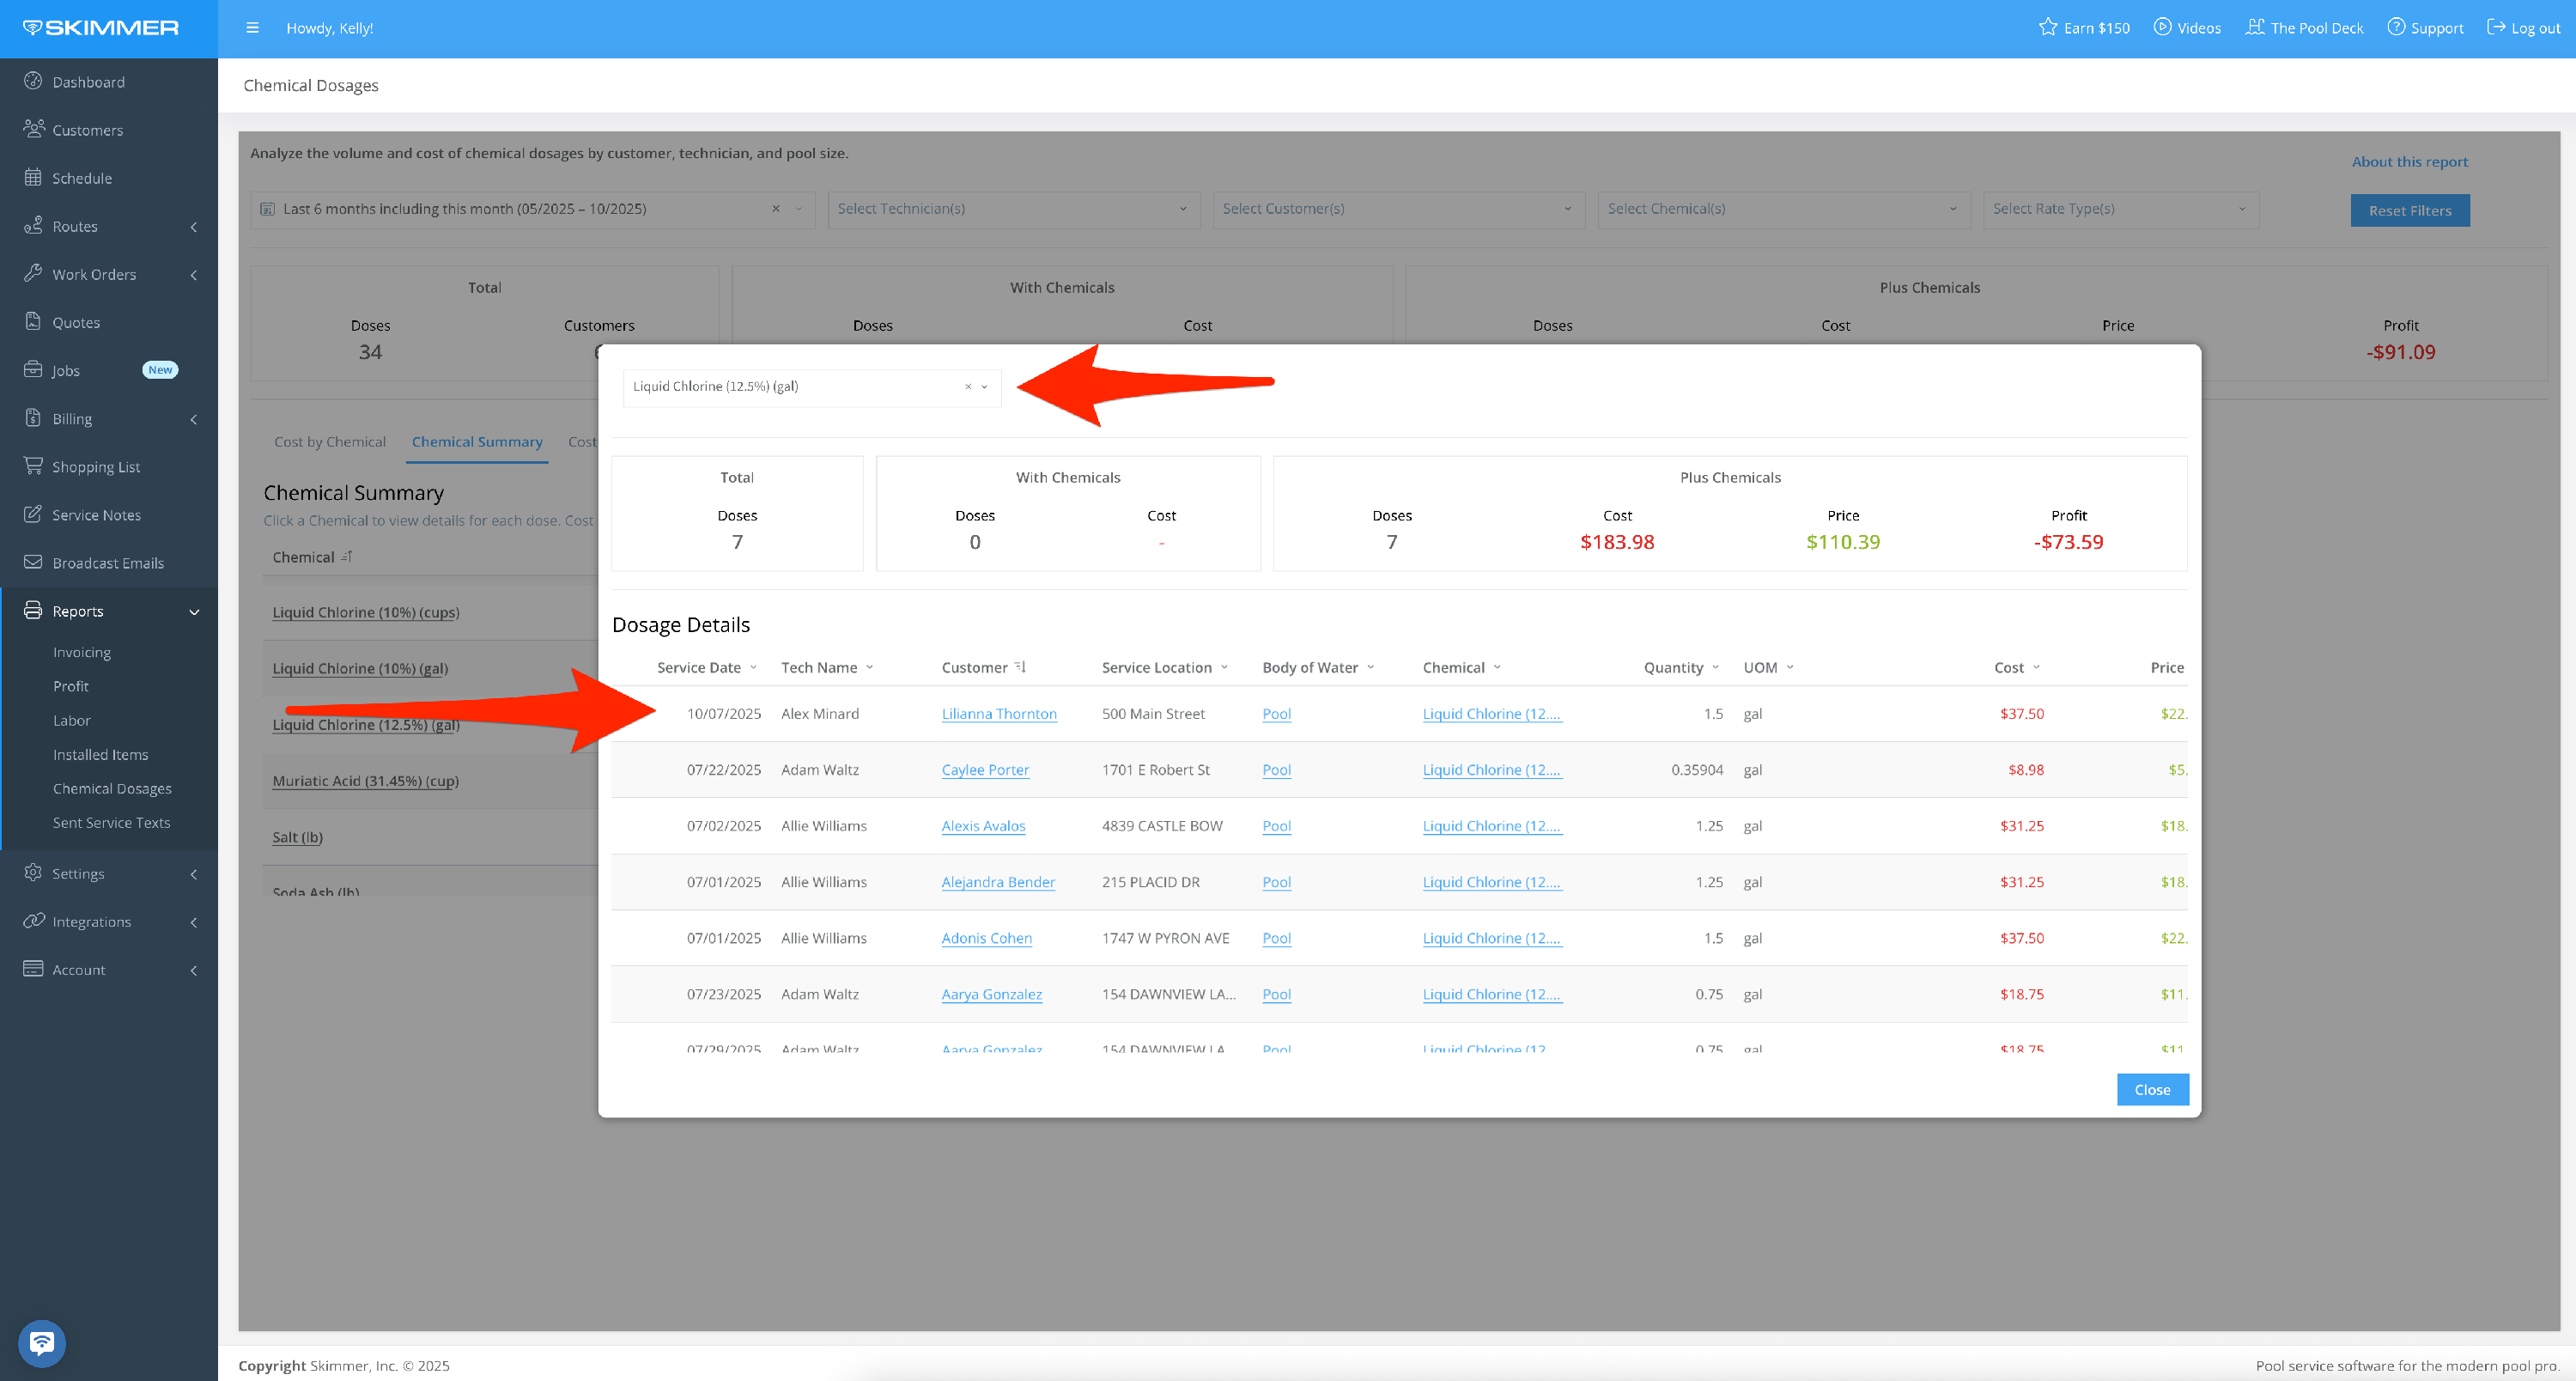
- Chemical Summary shows all chemicals administered to pools during a set date range. You can see how many times a chemical was added to a pool, the total quantity administered, and associated cost, and profit.
- Click any chemical name to get more details, such as where and when it was dosed, individual quantities, and the type of job it’s related to. You can use the selector at the top to switch between different chemicals in this view. For this table, as well as the Tech Summary and Customer Summary, you can sort the list by column.
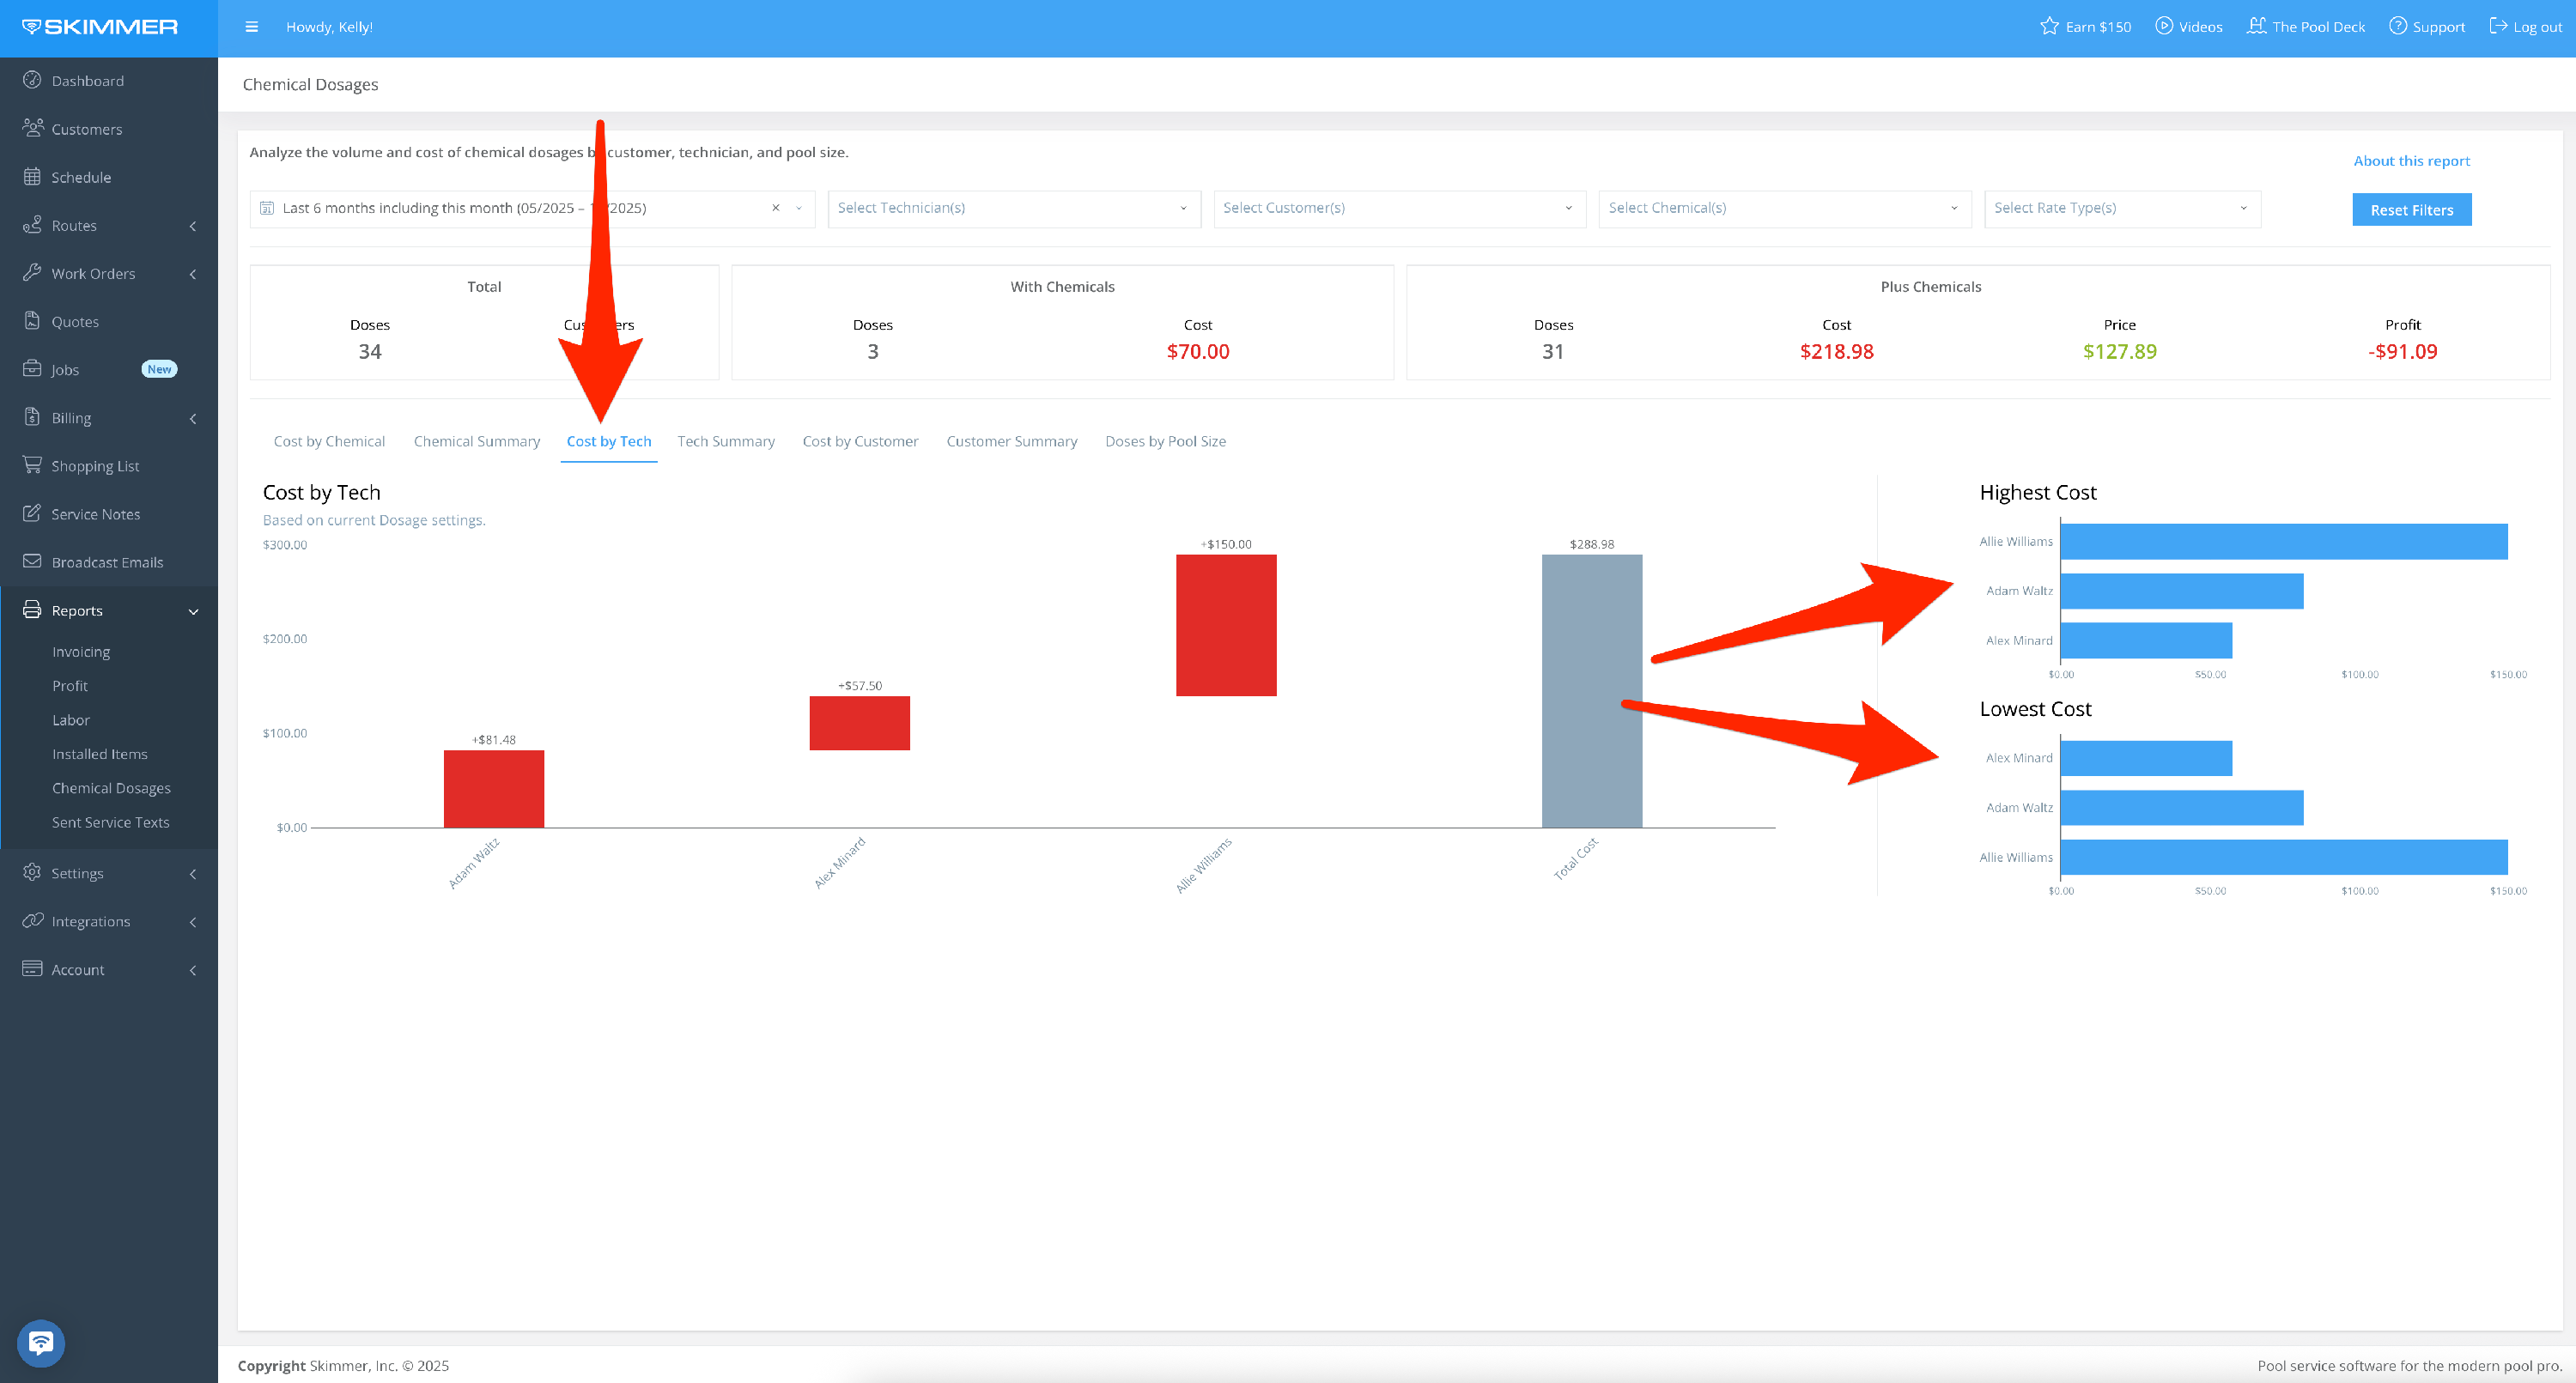
- Cost by Tech gives you the same data as Cost by Chemical, organized by the tech who did the work.
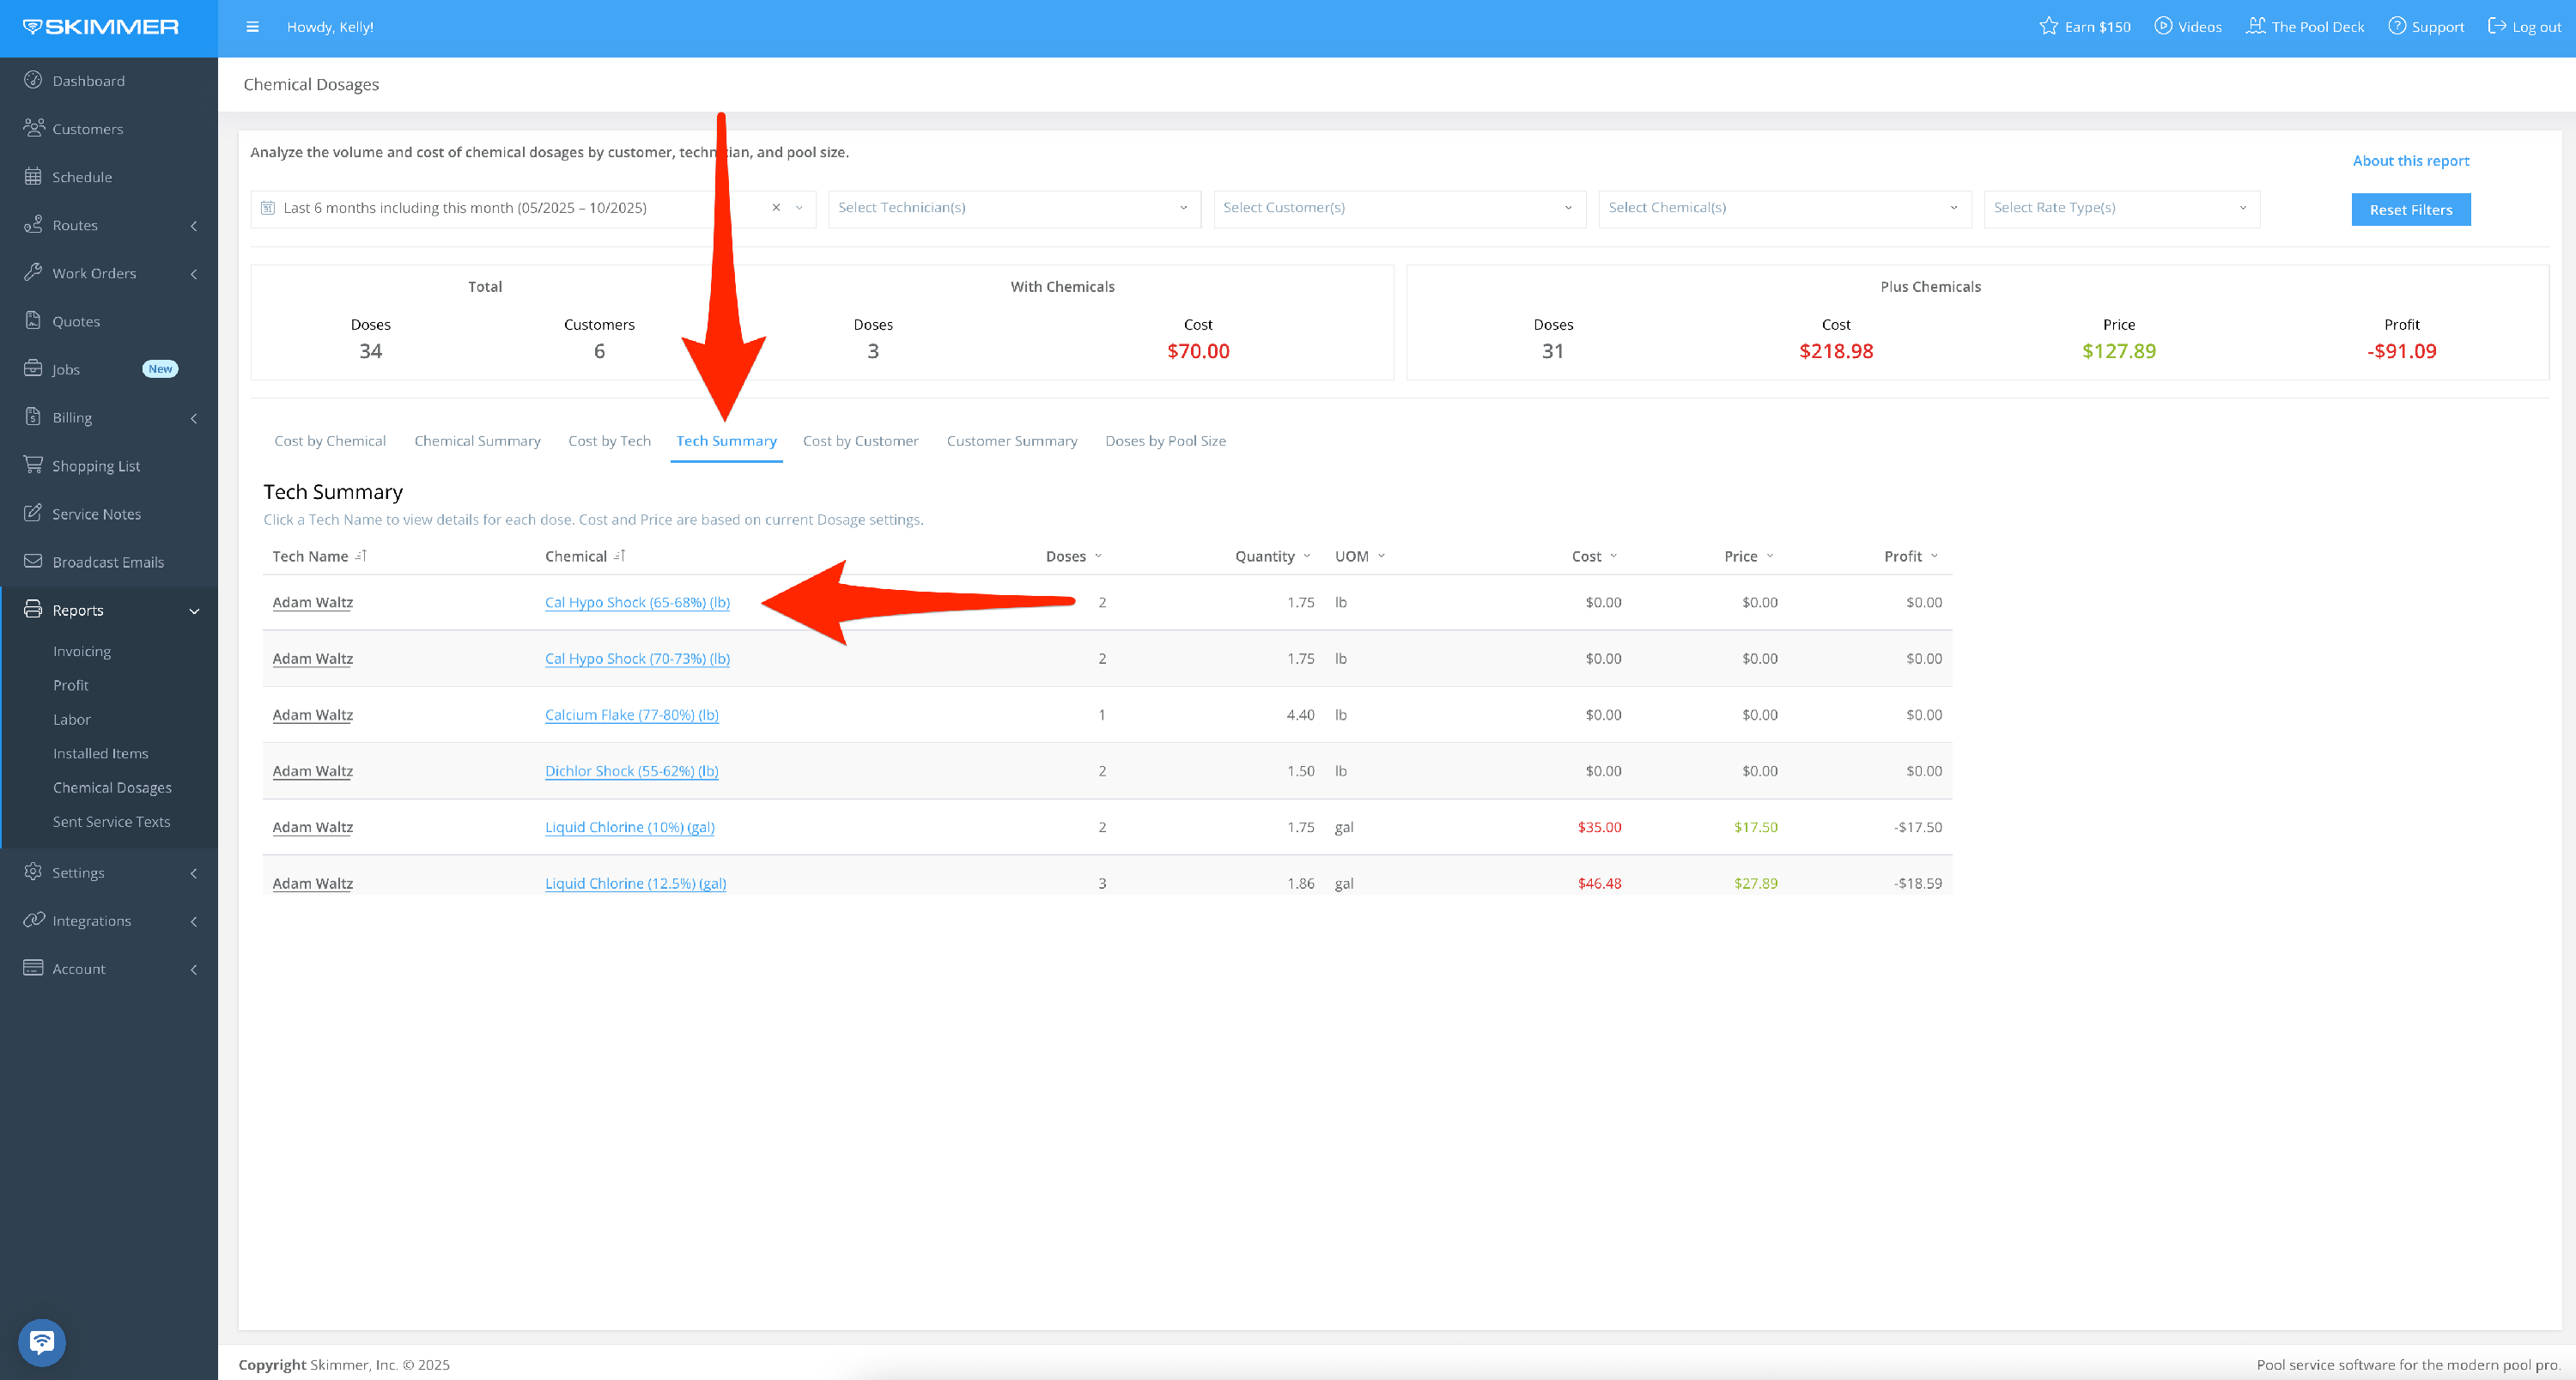
- Tech Summary gives the full breakdown of every dosage administered by selected techs within your date range, including quantity, cost, price, and profit.
- For even more information, click on a tech’s name and the pop-up screen will show every customer and location serviced, as well as distribution between rate types. If a dosages was part of a work order, you’ll get a reference to it. You can also use the Tech dropdown to switch between techs without having to exit this view.
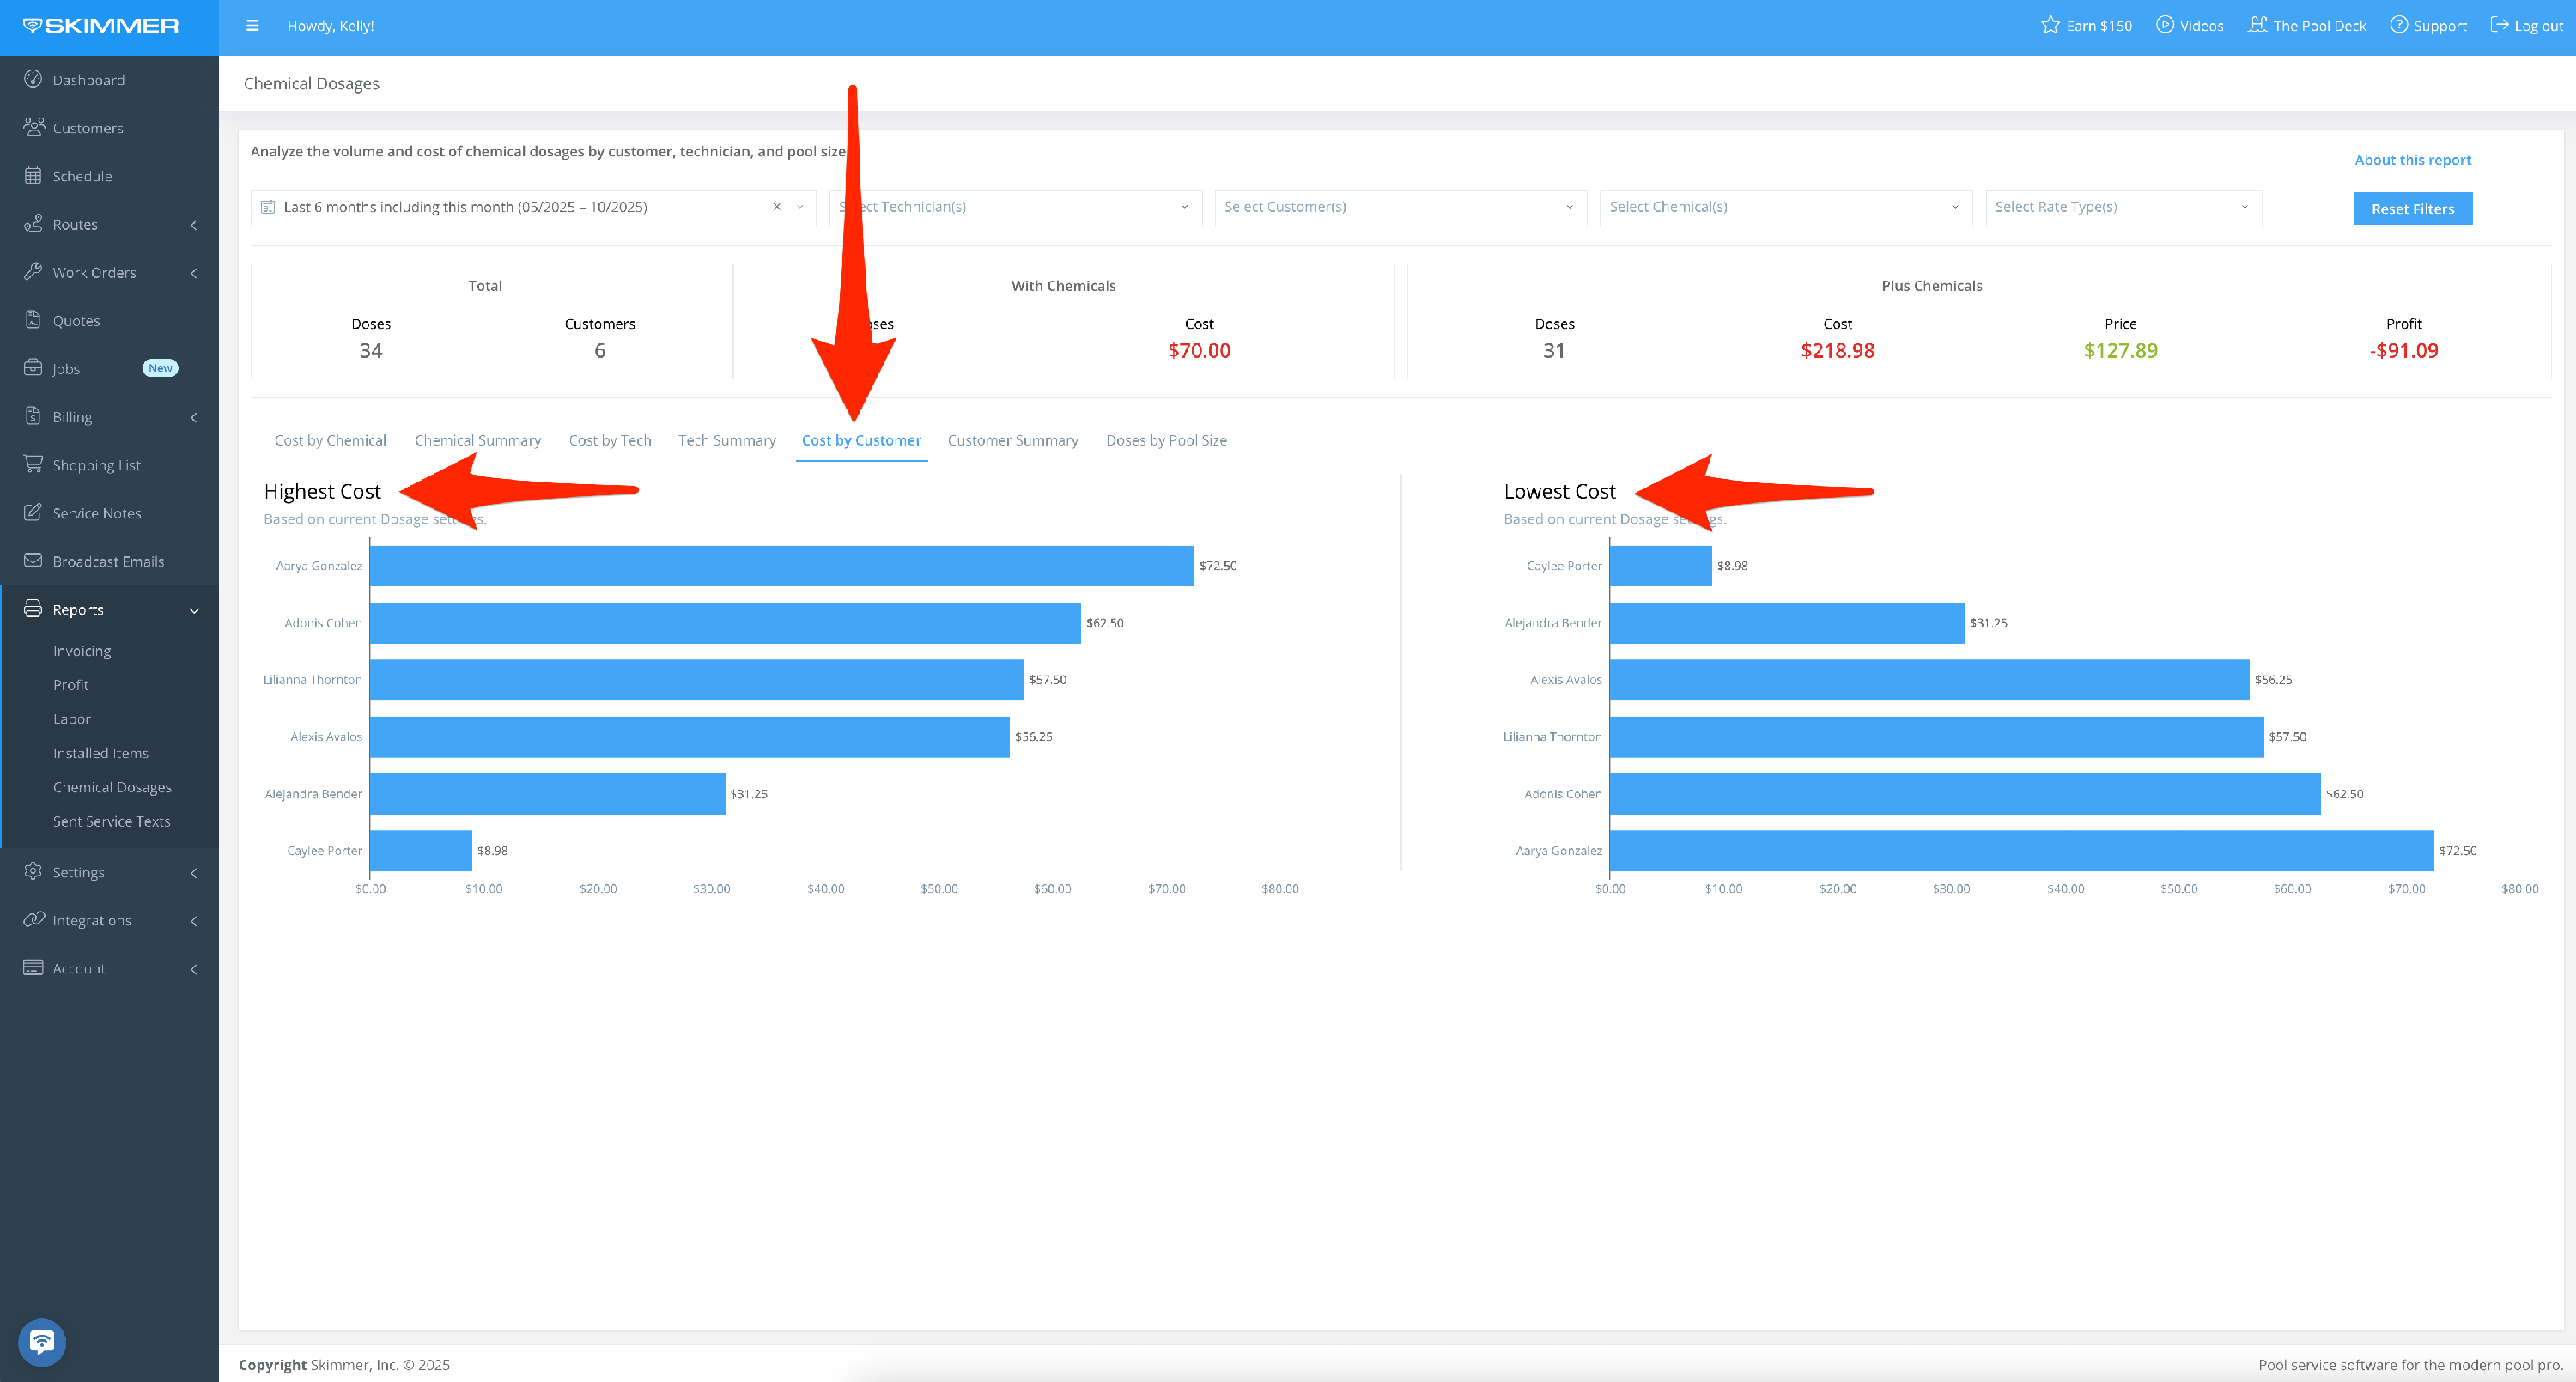
- Cost by Customer is a great way to see a quick summary of which customers are receiving the most chemicals in their pool. It’s a snapshot of highest-use and lowest-use customers.
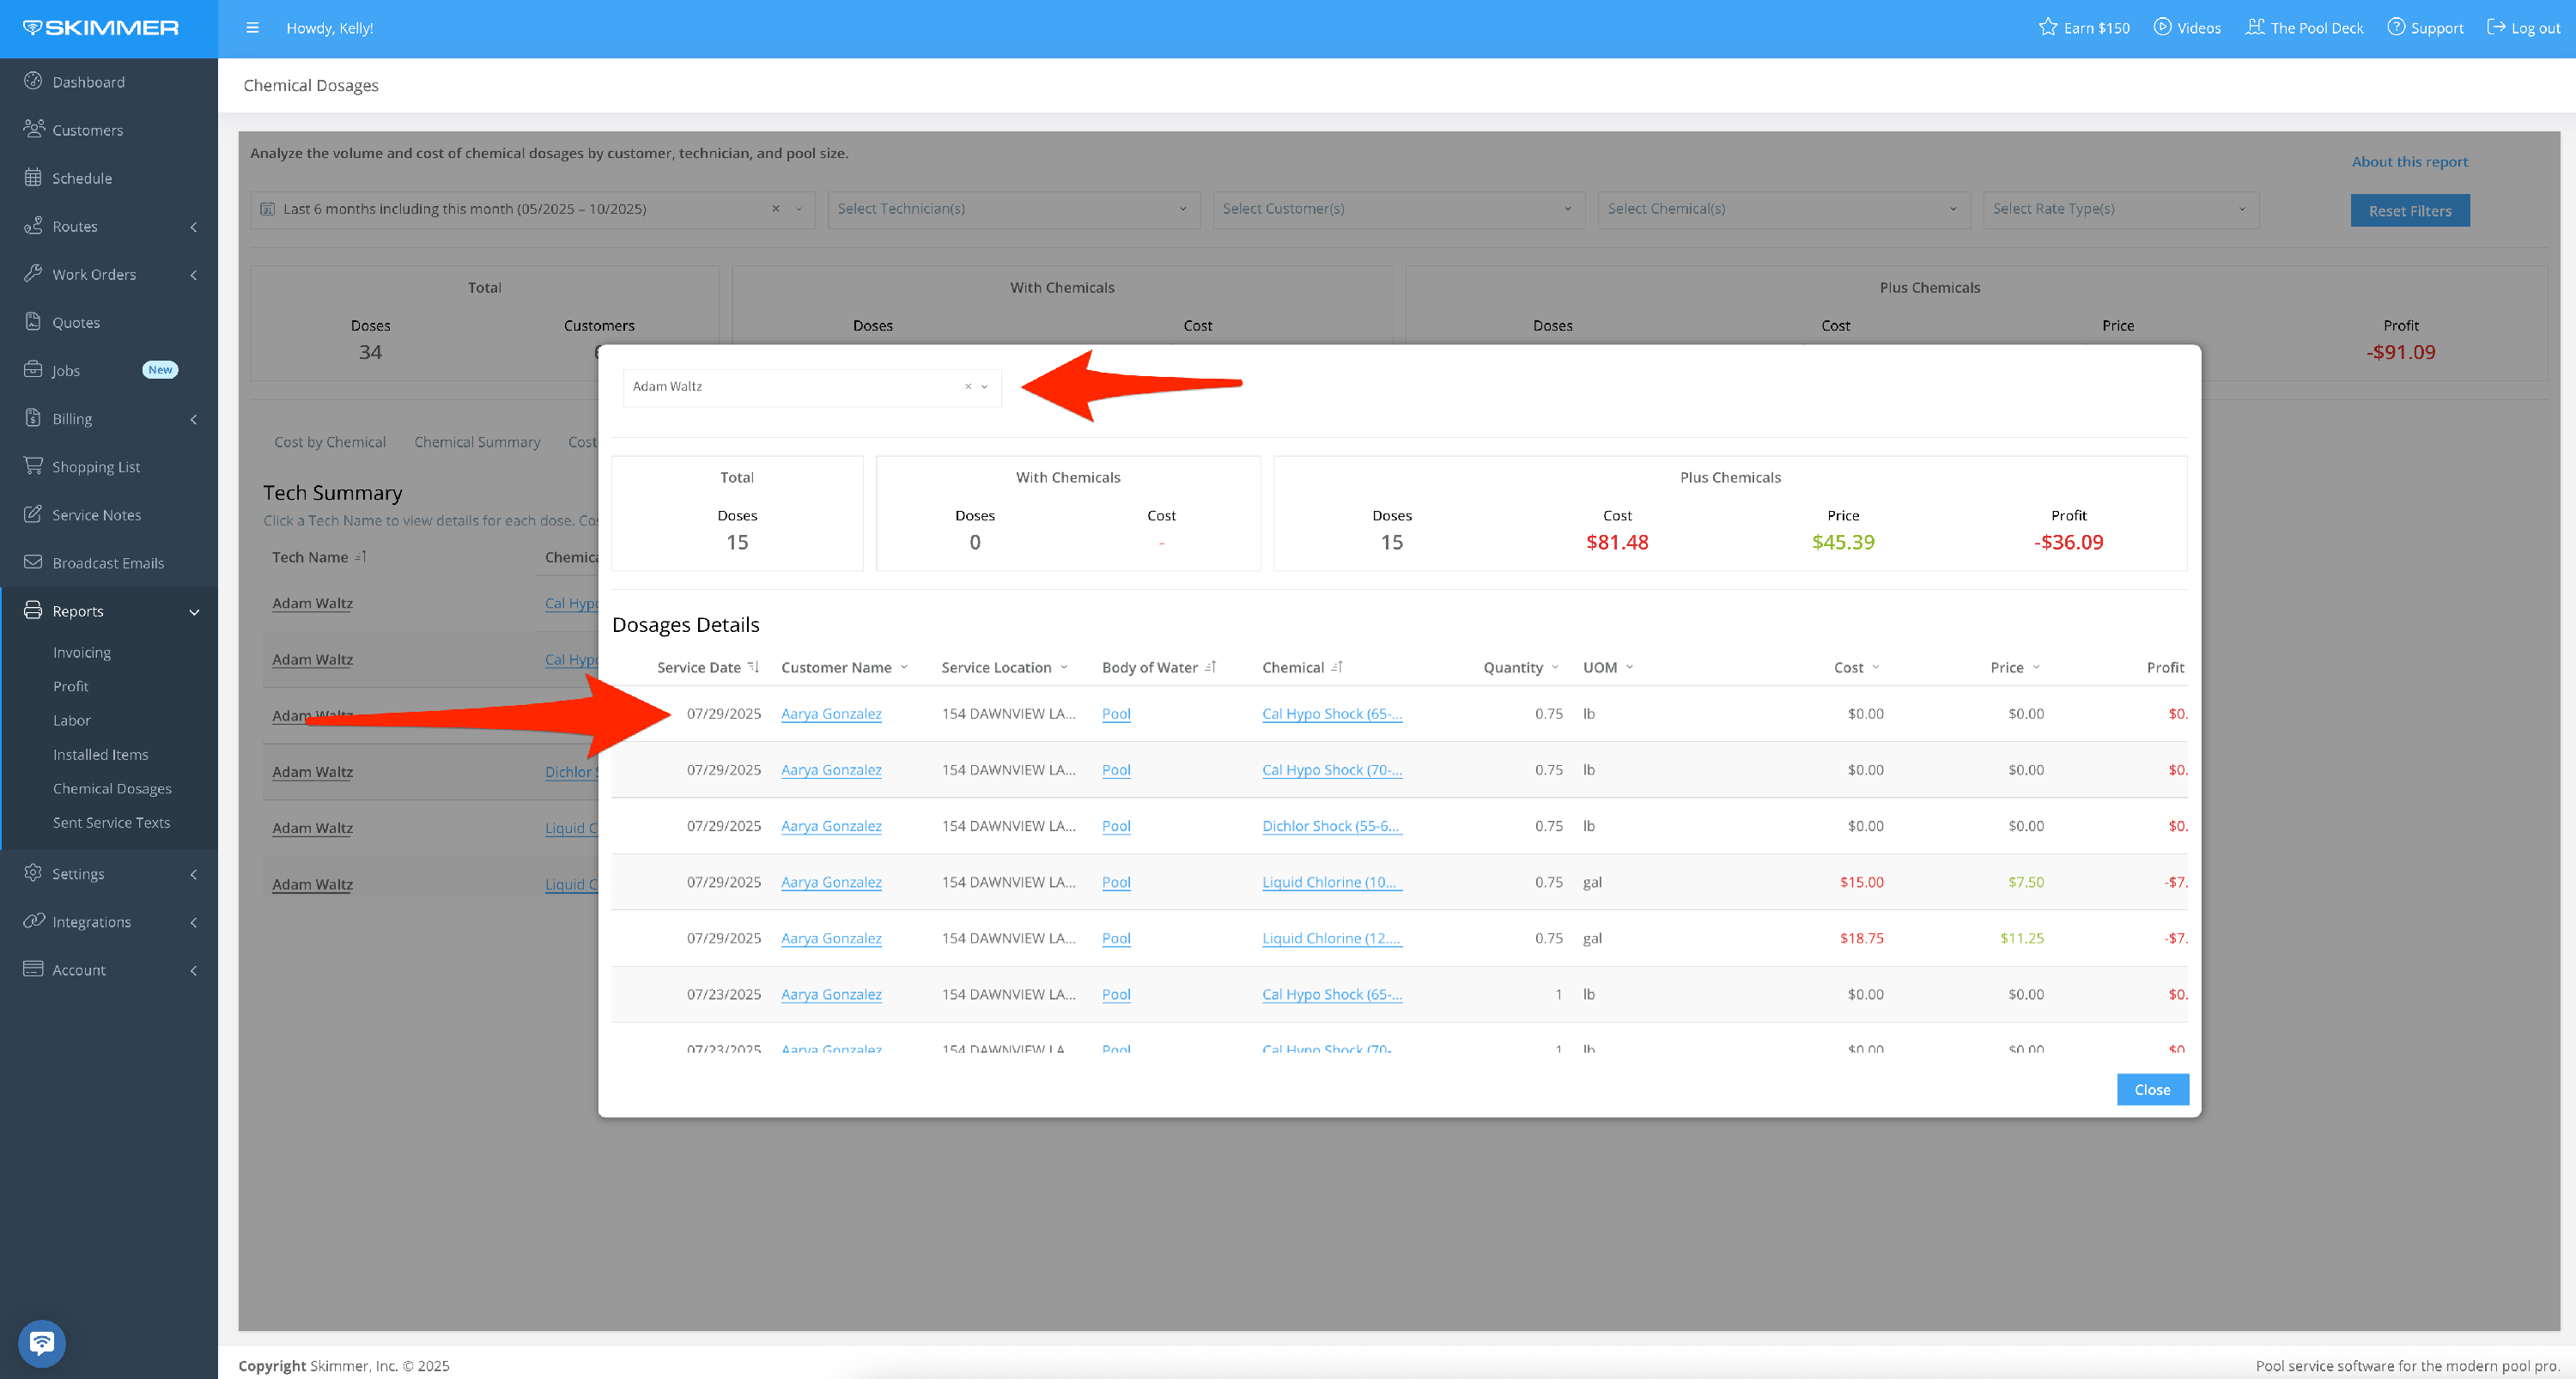
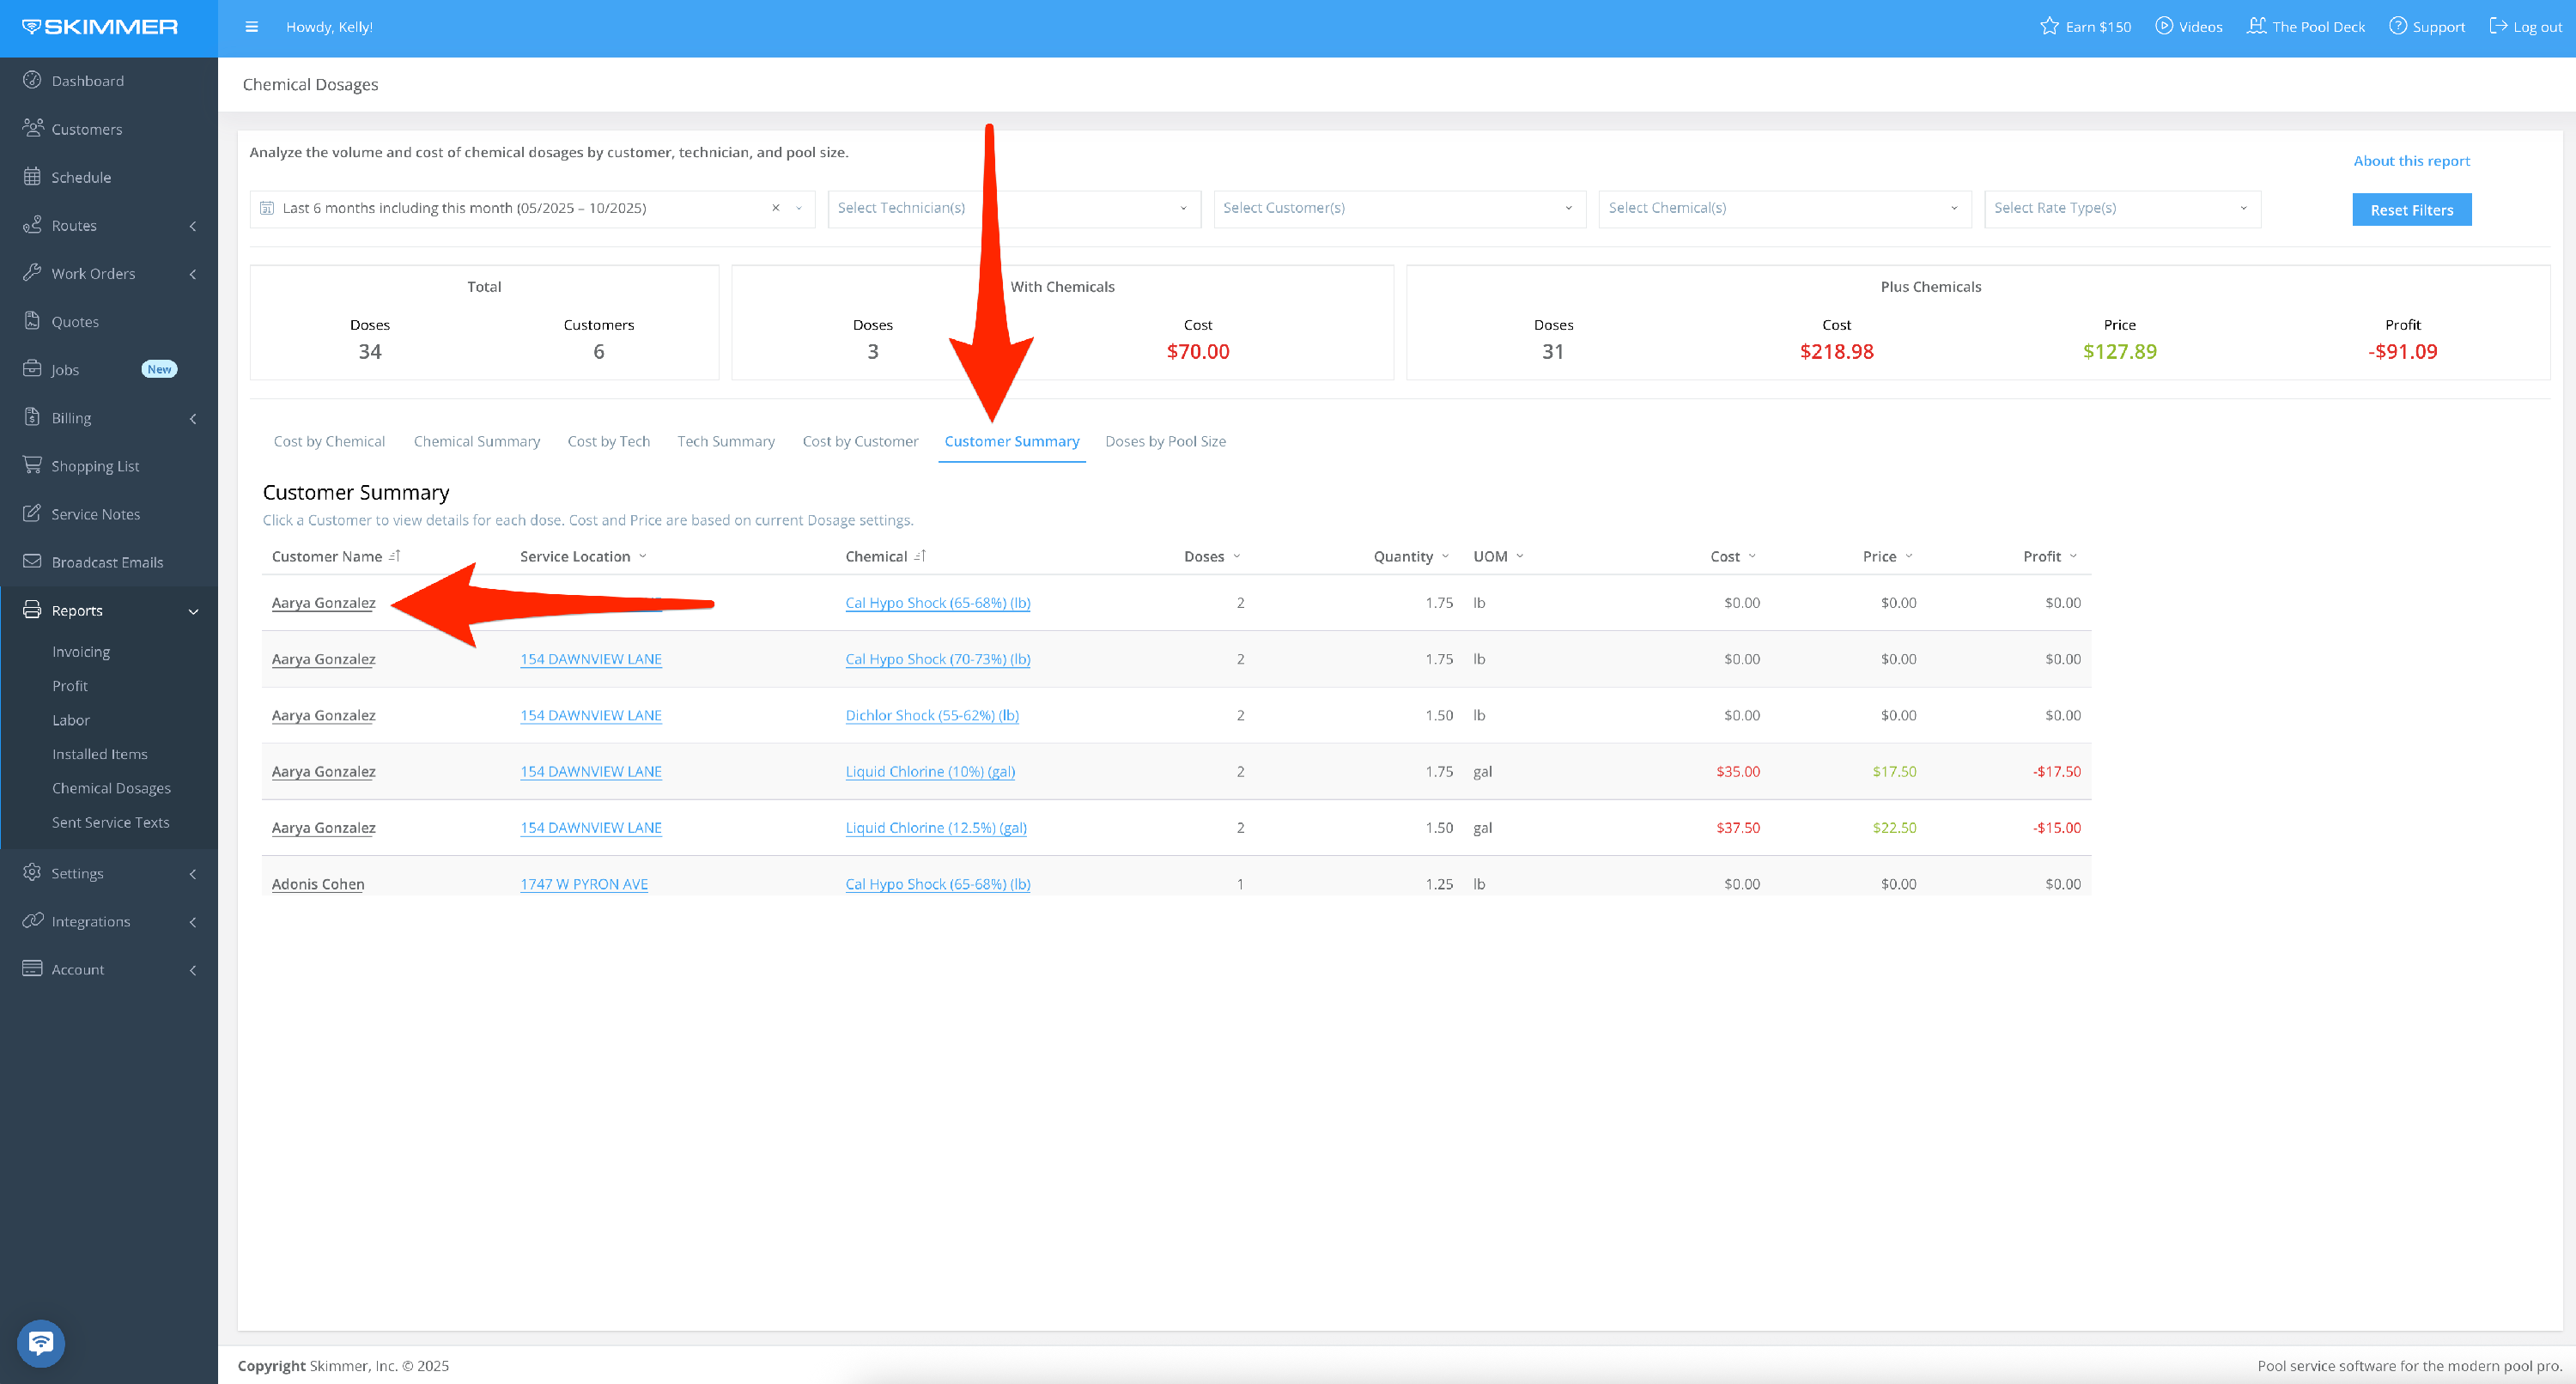
- Customer Summary gives full list of all customers who received chemical dosages during your date range along with cost, price, and profit.
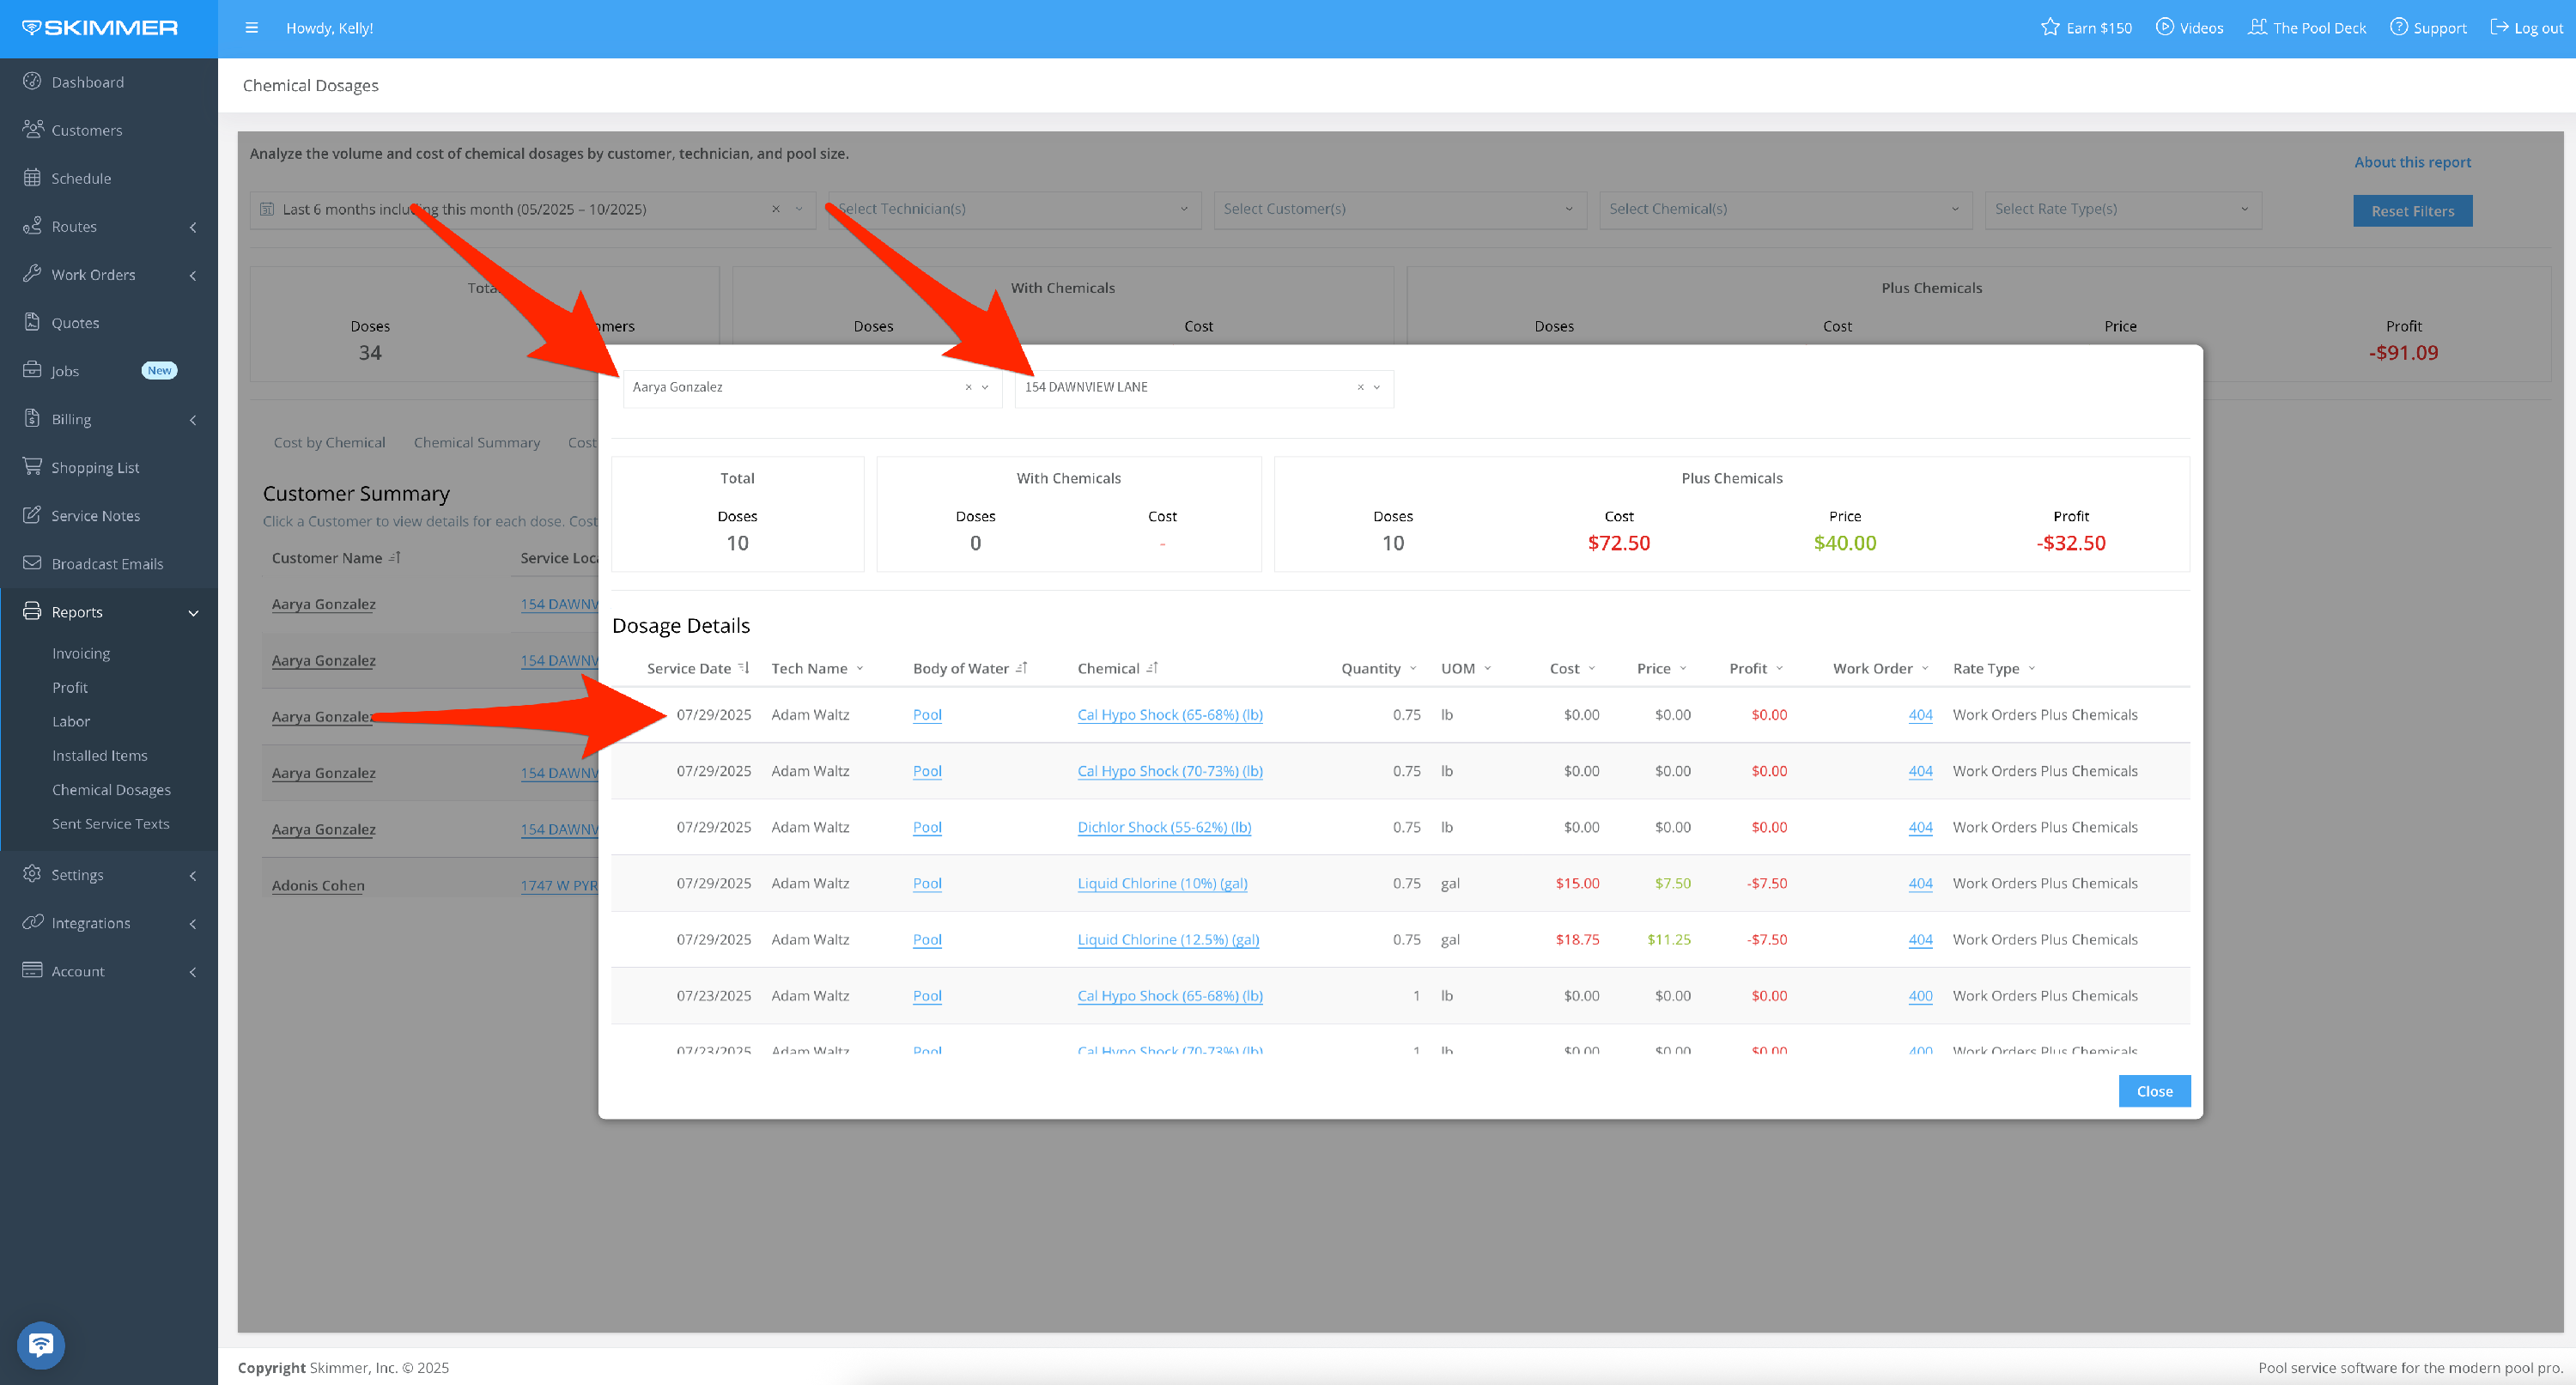
- For even more information, click on a customer’s name and the pop-up screen will show every service date, body of water, and dosage details. If they have multiple service locations, you can view them all or filter down to a selection. You can also use the Customer dropdown to switch between customers without having to exit this view.
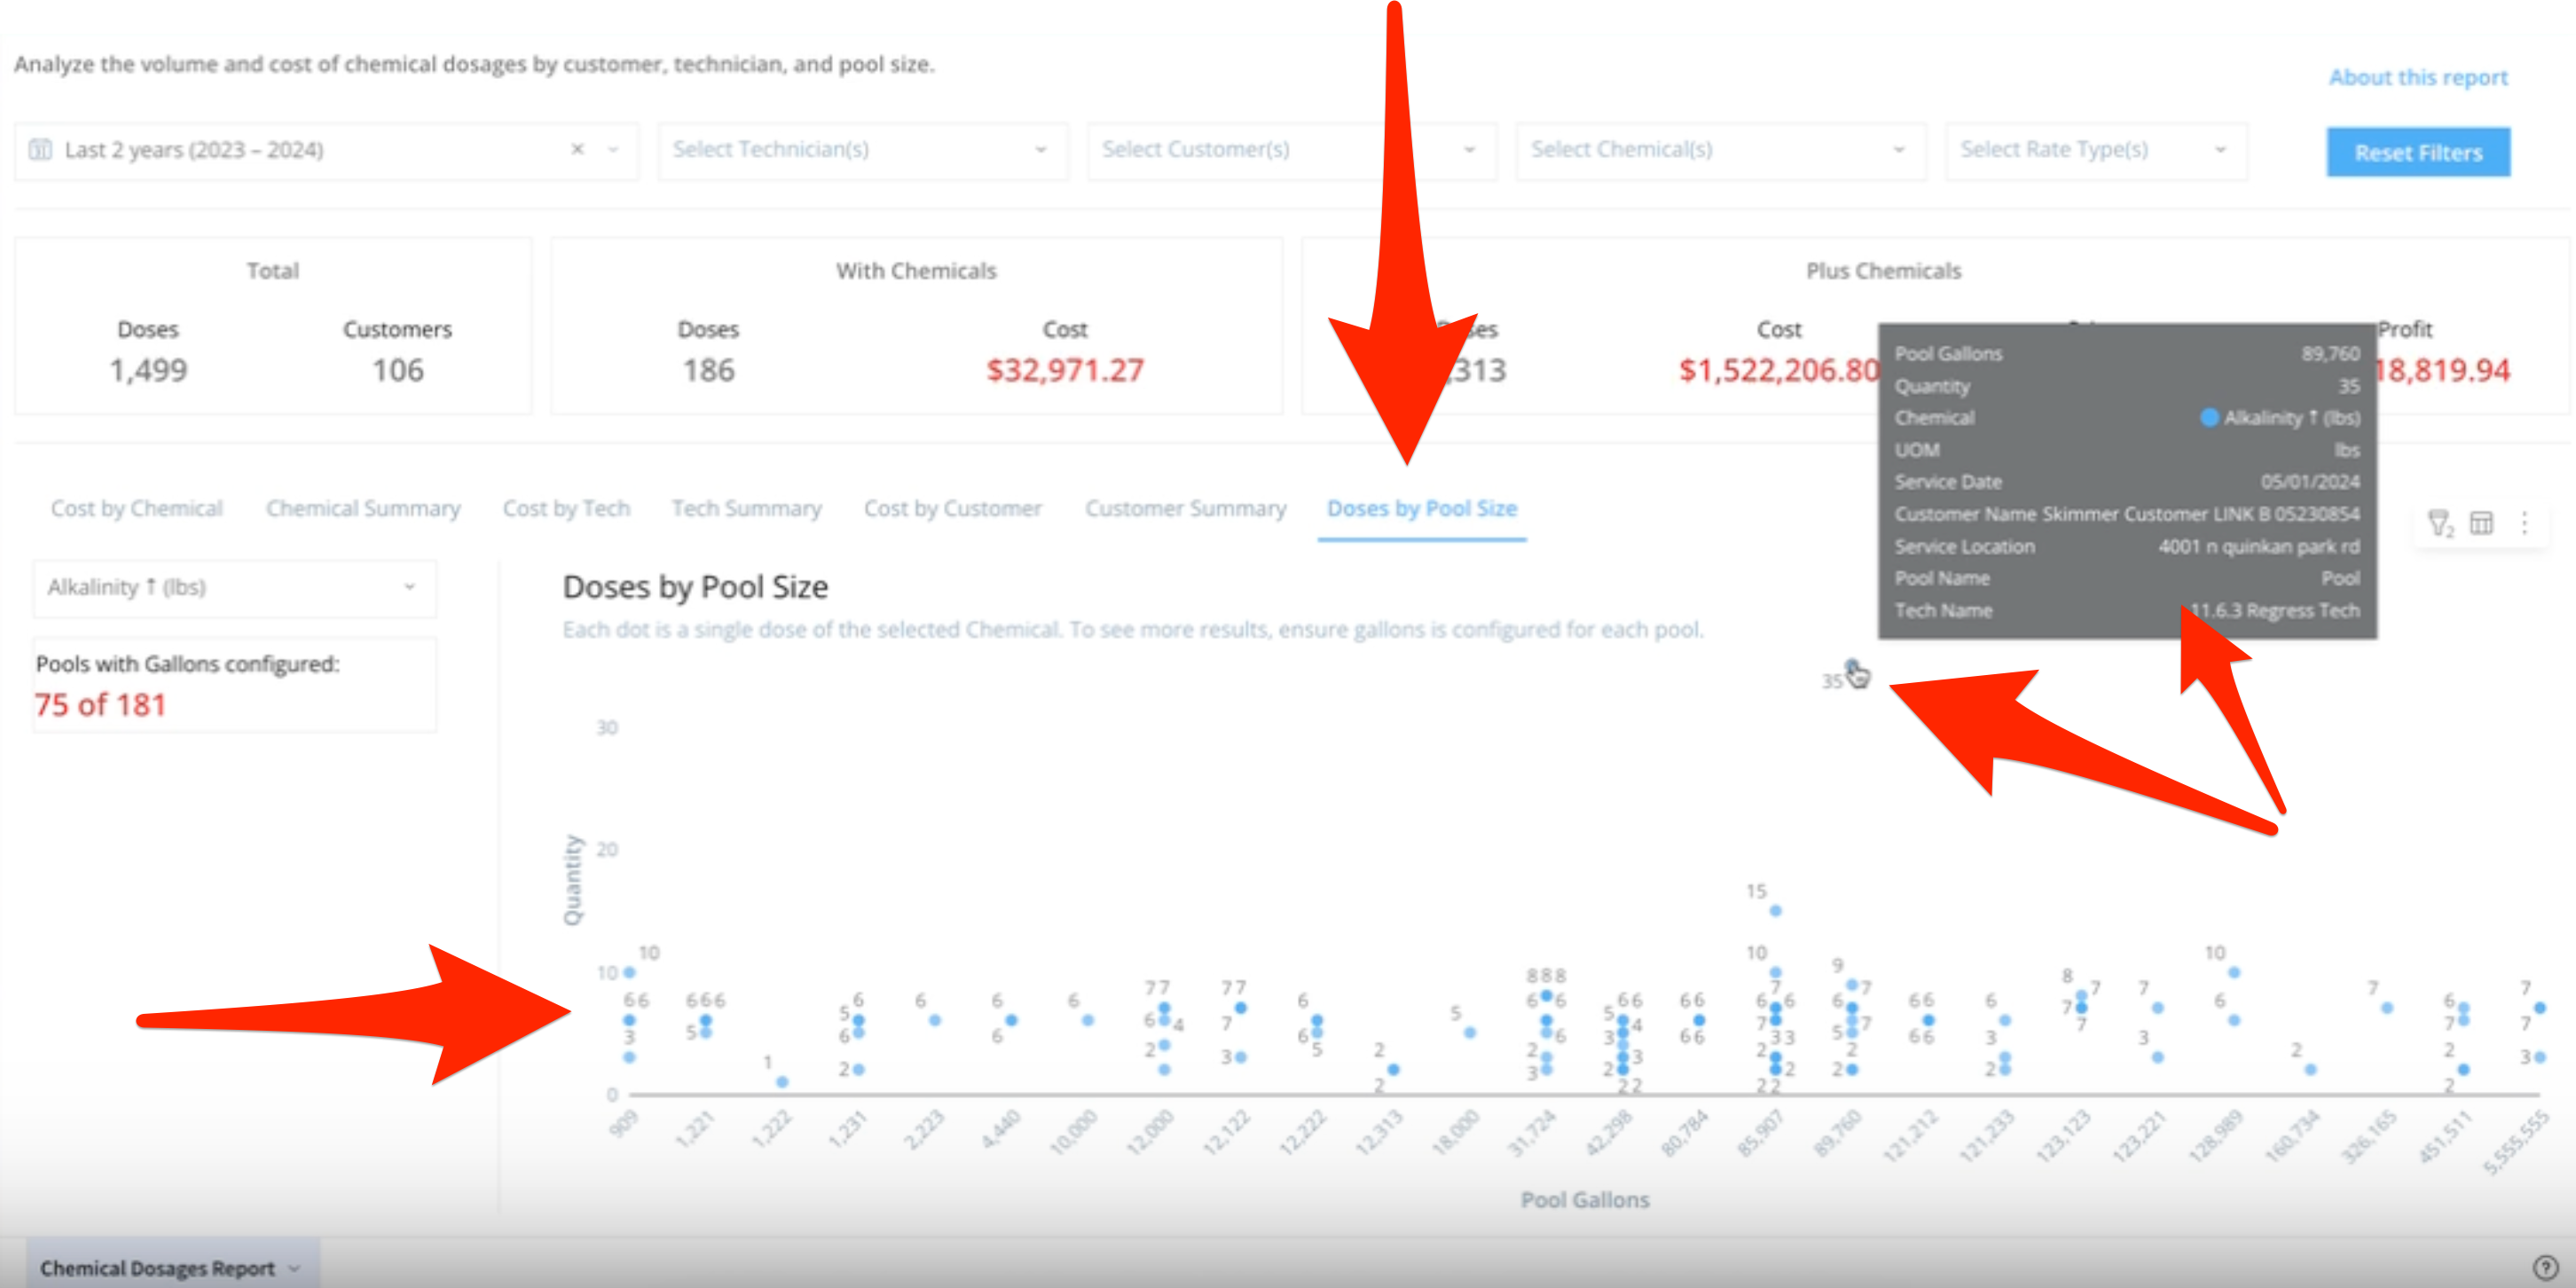
- Doses by Pool Size shows a scatter plot where each dot is a single dose of the selected chemical. The graph shows the quantity of each dose on the Y axis and pool size on the X axis. Displaying the data this way helps identify trends related to chem dosage size as it relates pool size, and it makes it easier to identify outliers and exceptions. Hover over a dot and a box will appear with data related to that dosage, such as service date, location, and tech. The more pools for which you’ve indicated gallon/size, the more data you’ll be able to see here.
- 8
-
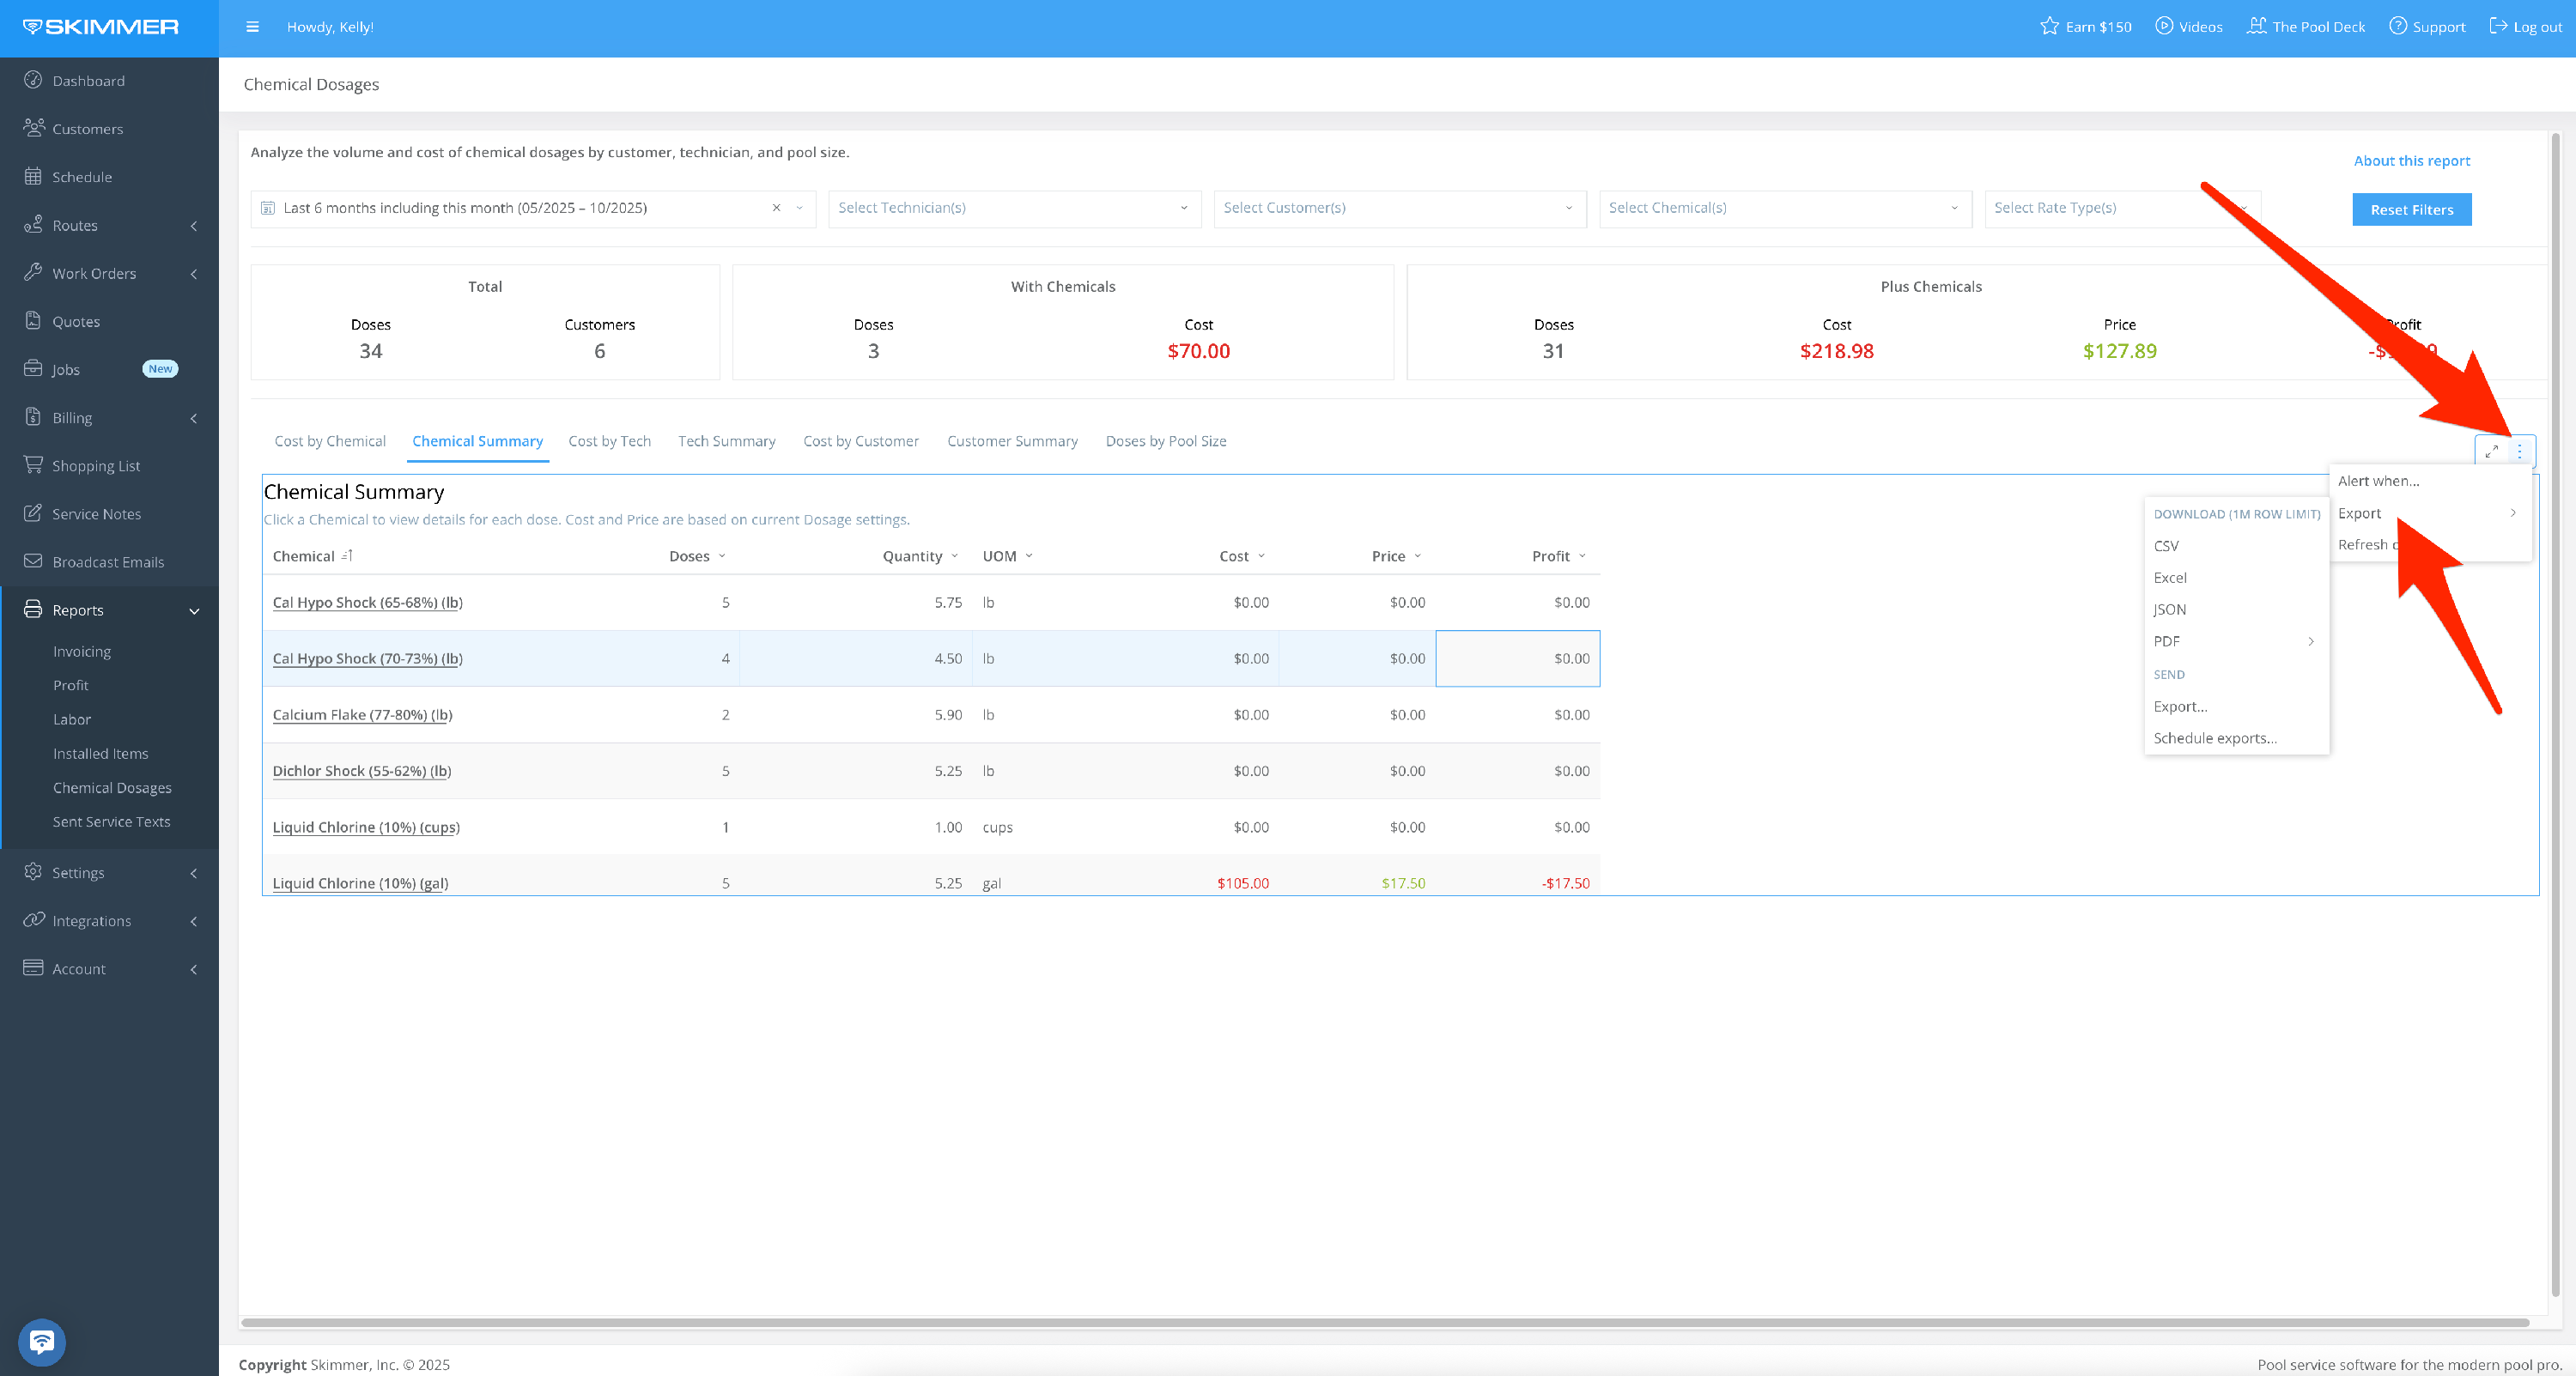
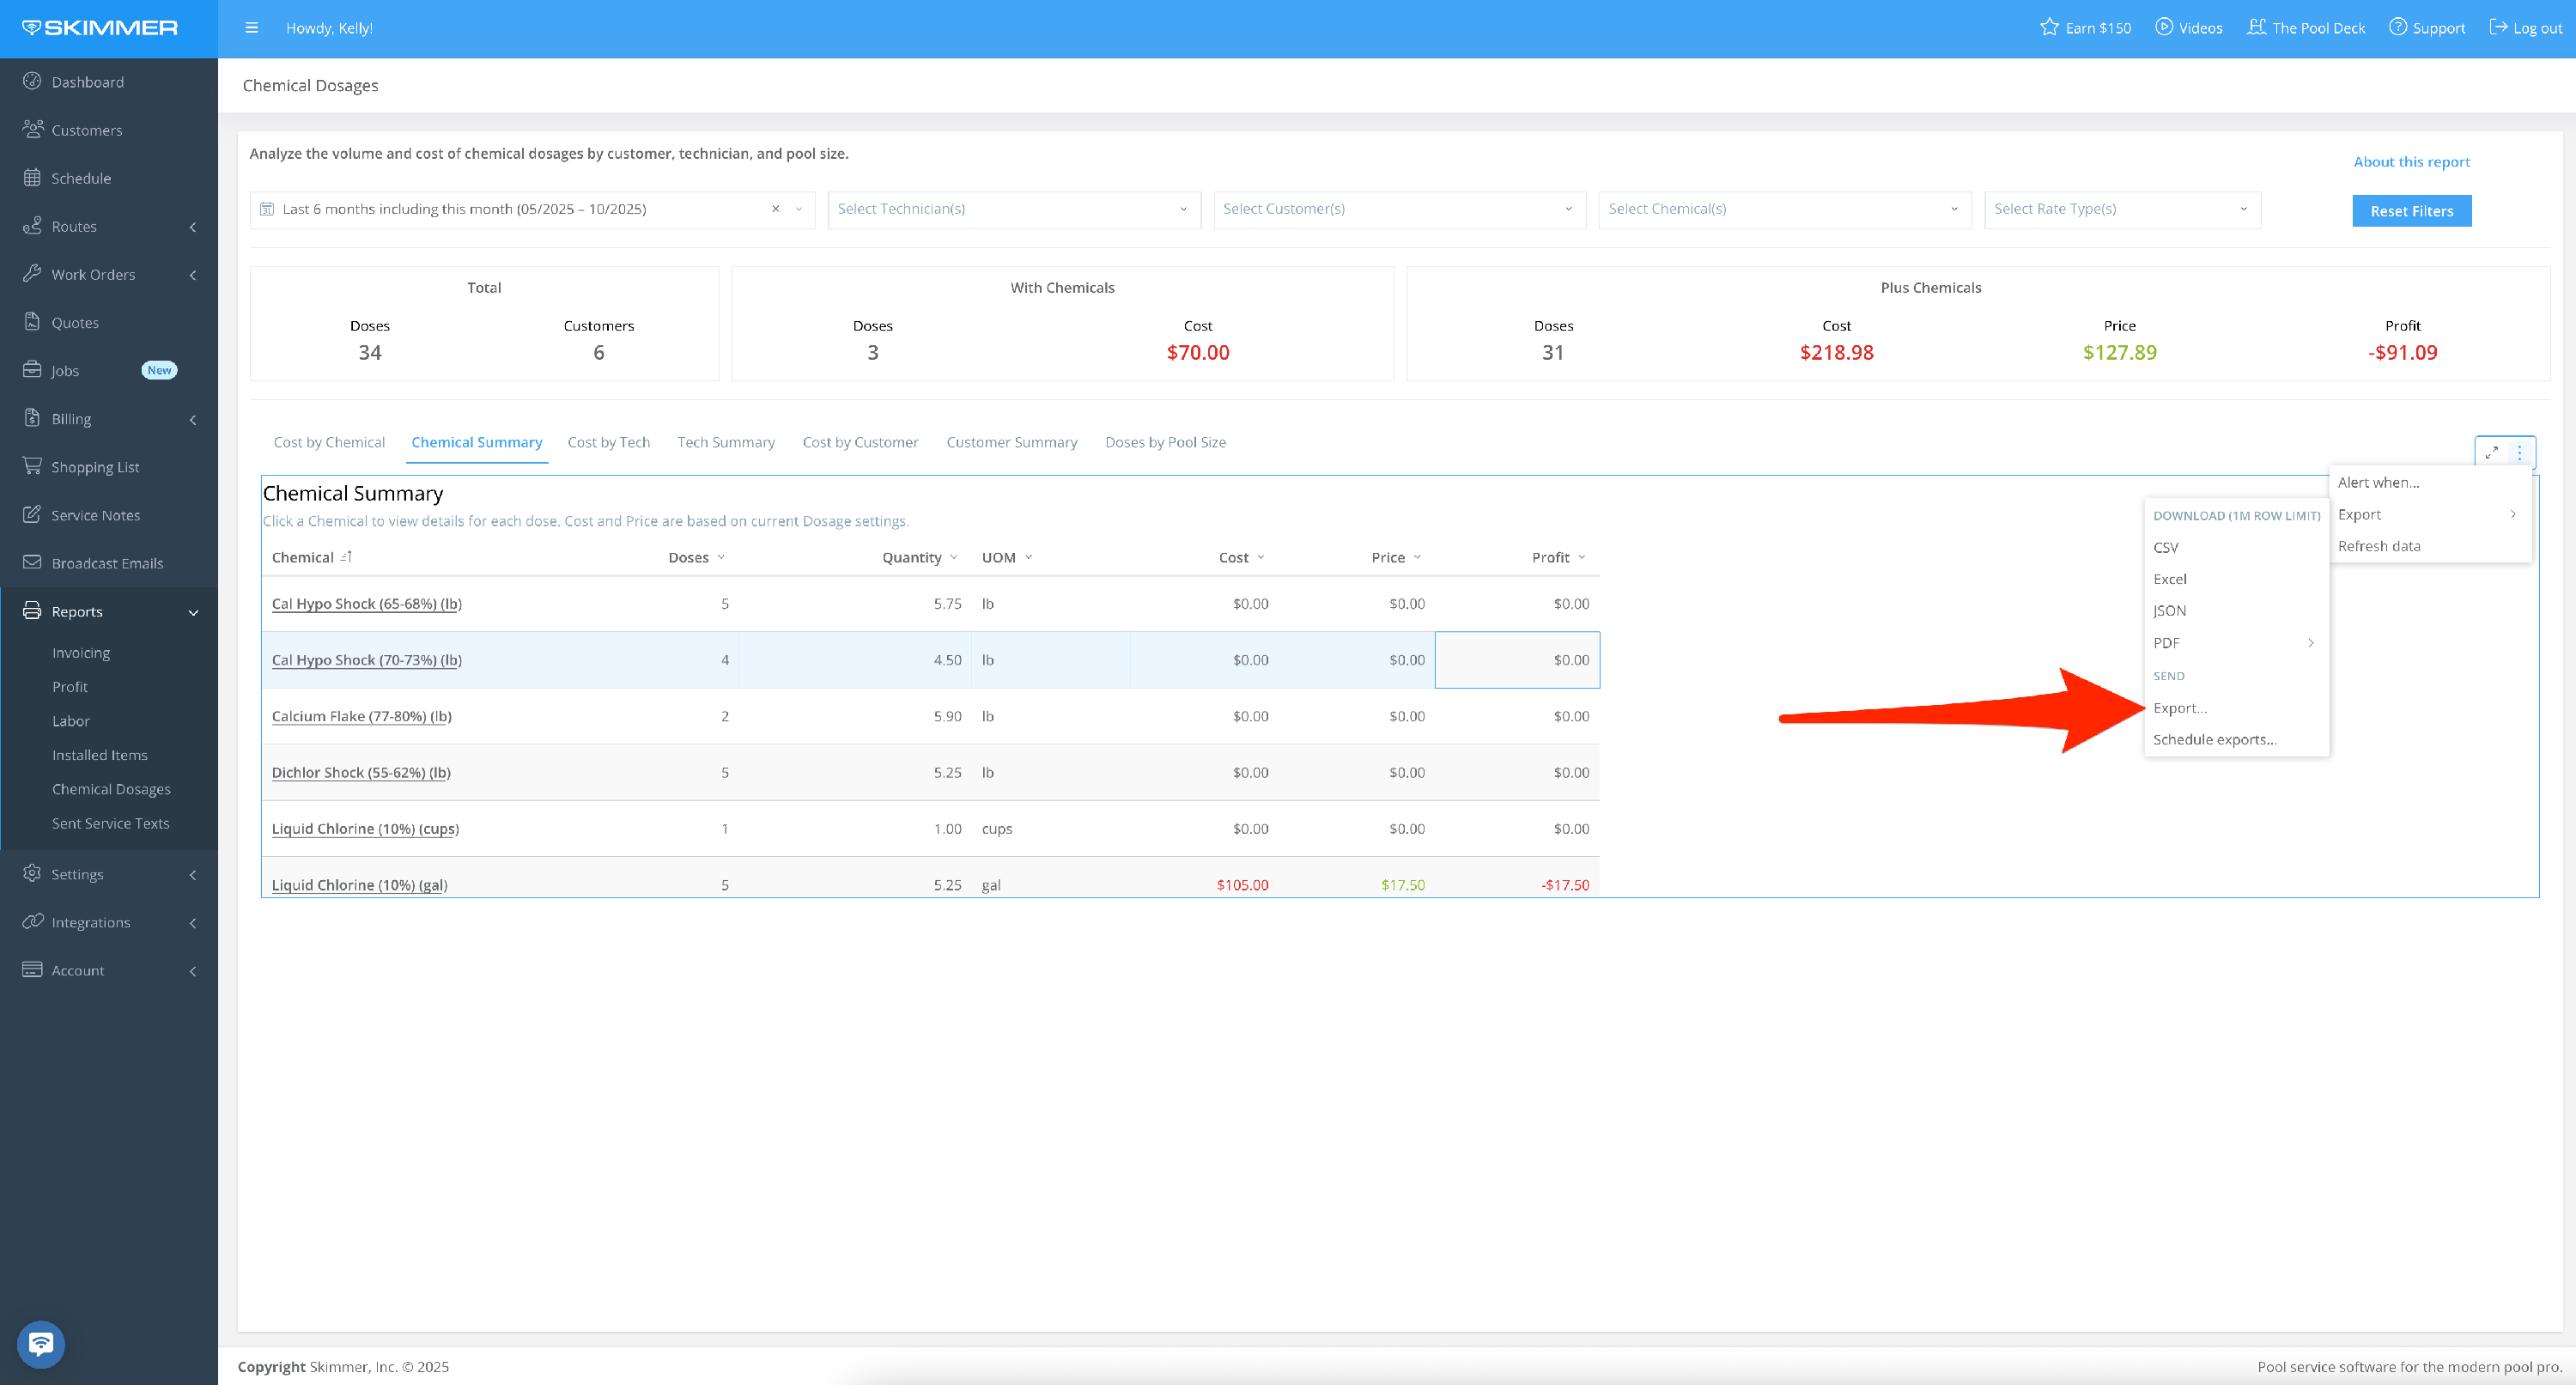
To export data:
- Hover or click on a chart or table. Find the three dots that appear in the top right of the frame and click. This will give you options for working with the data in the chart you selected, including the ability to export it in various formats. This is useful if you want to view and analyze the information in your own way.
- If you export as a PDF or PNG, you’ll get an image of what you selected. If you export to Excel or CSV, you’ll get a table with the underlying data. These options will download the export directly to your computer.
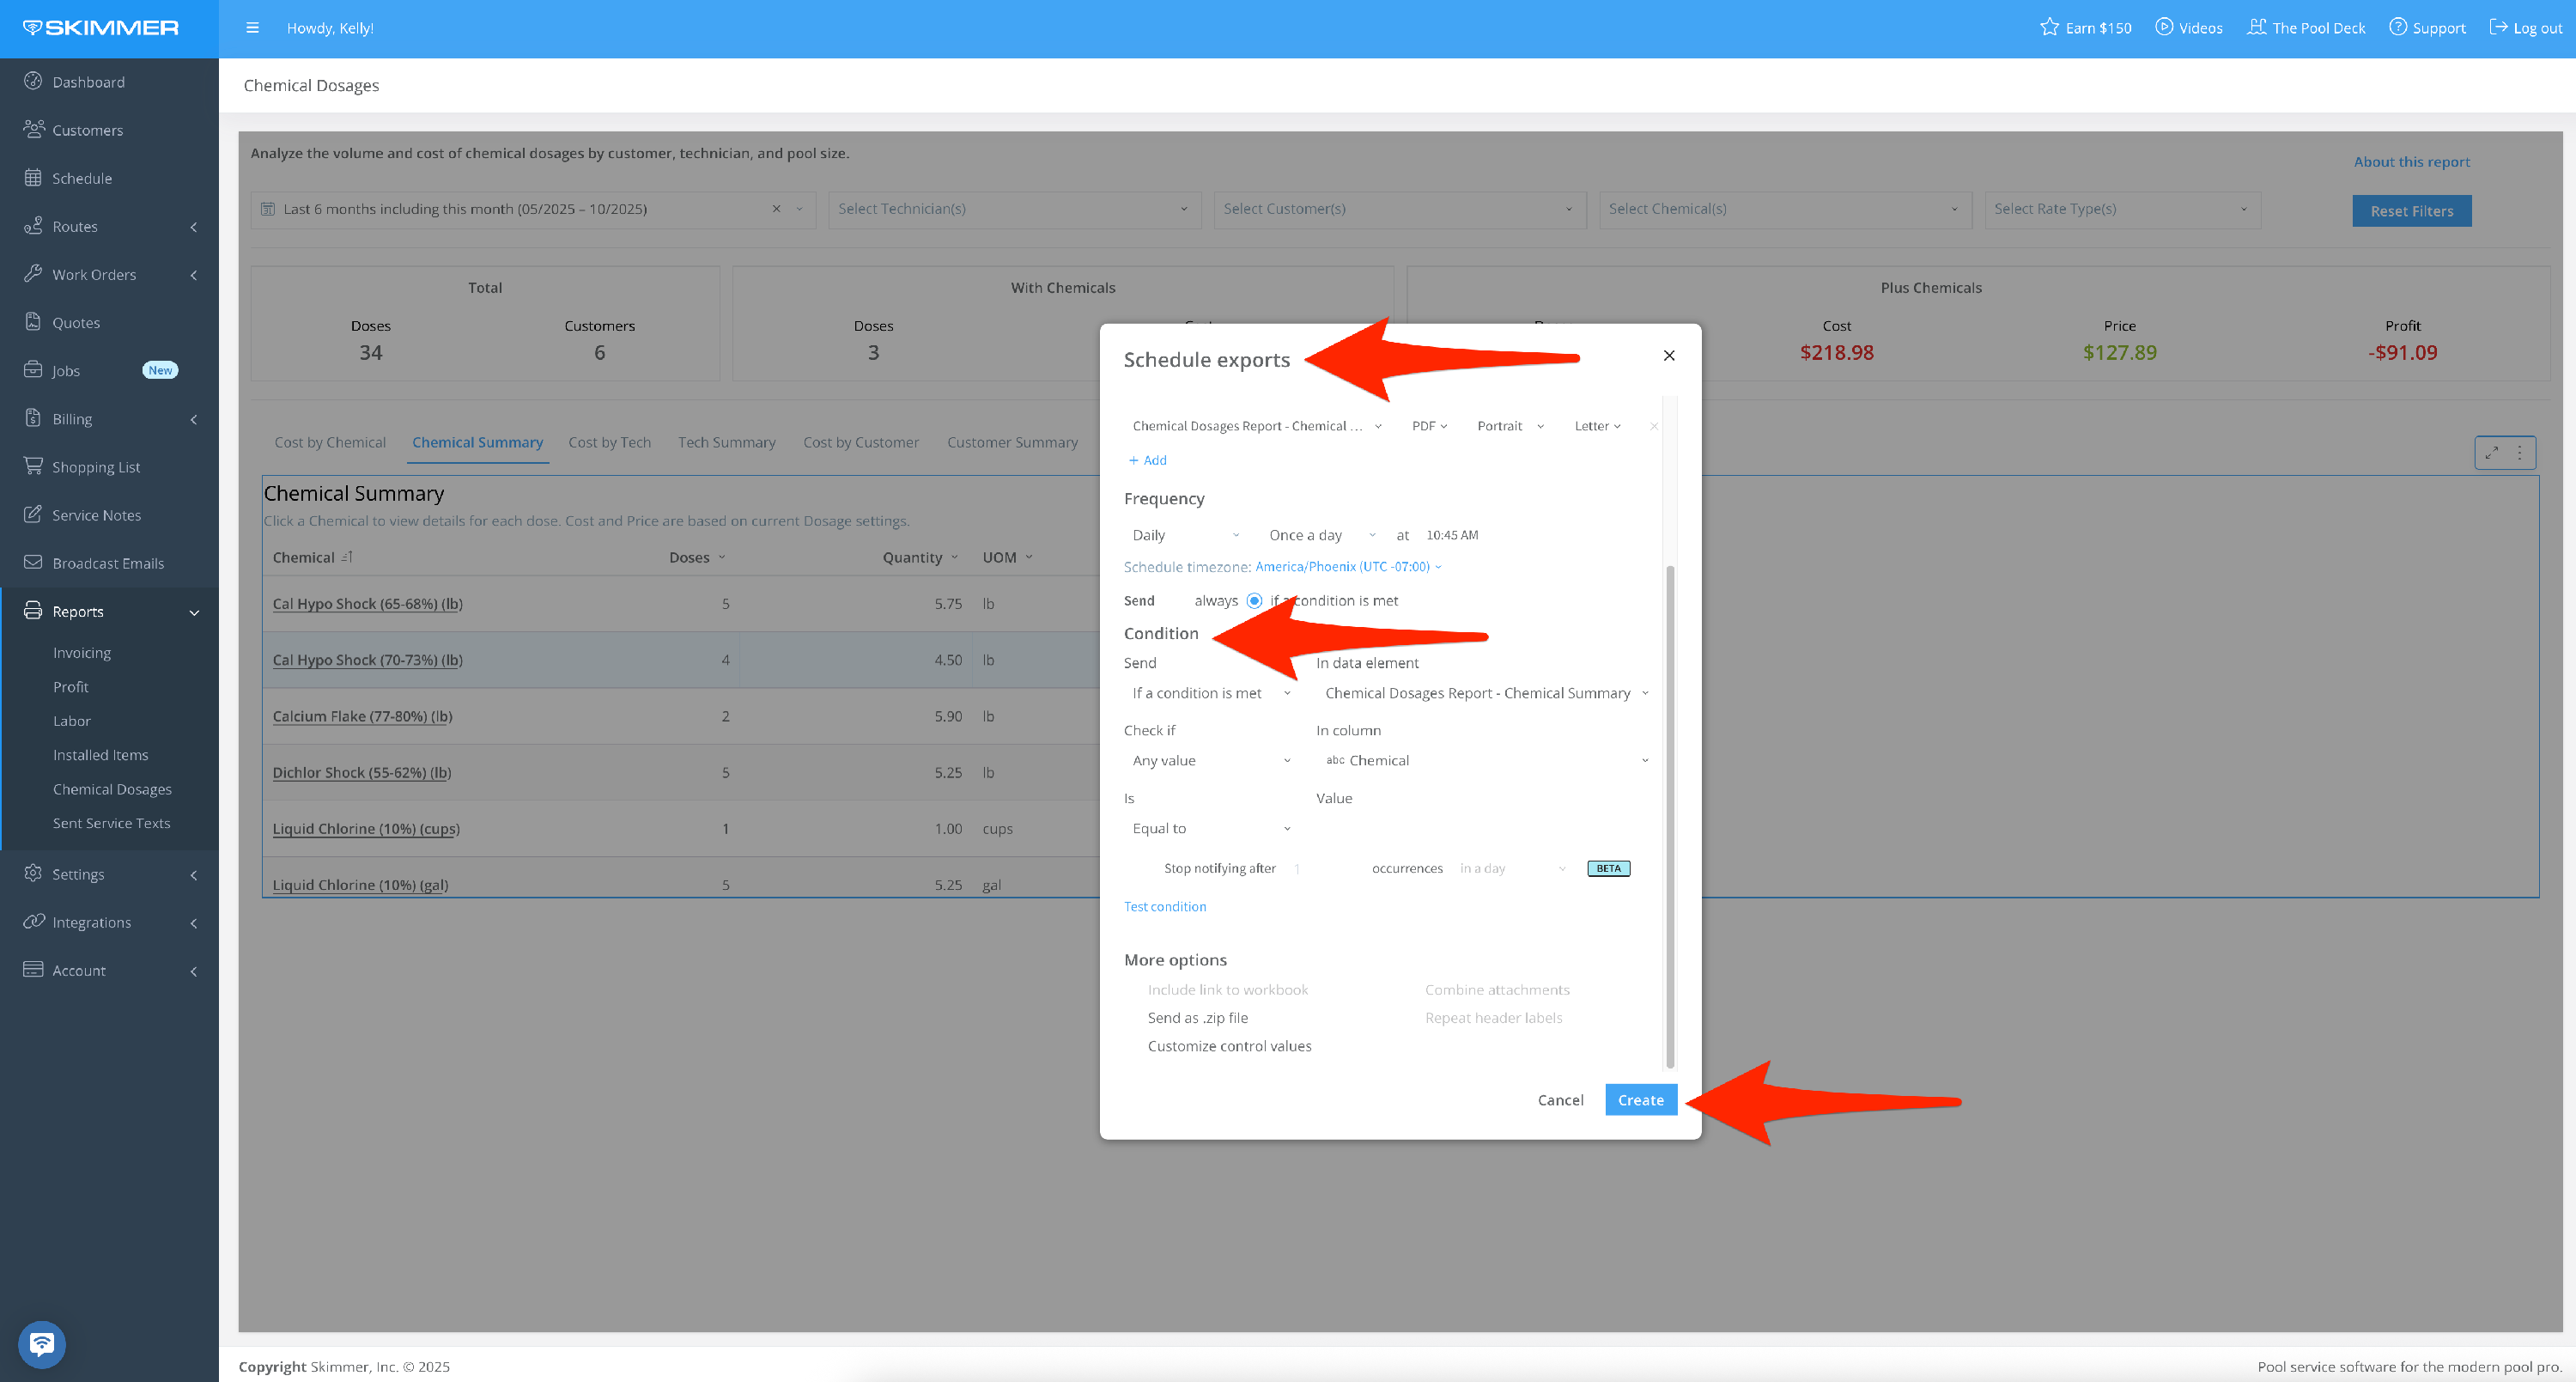
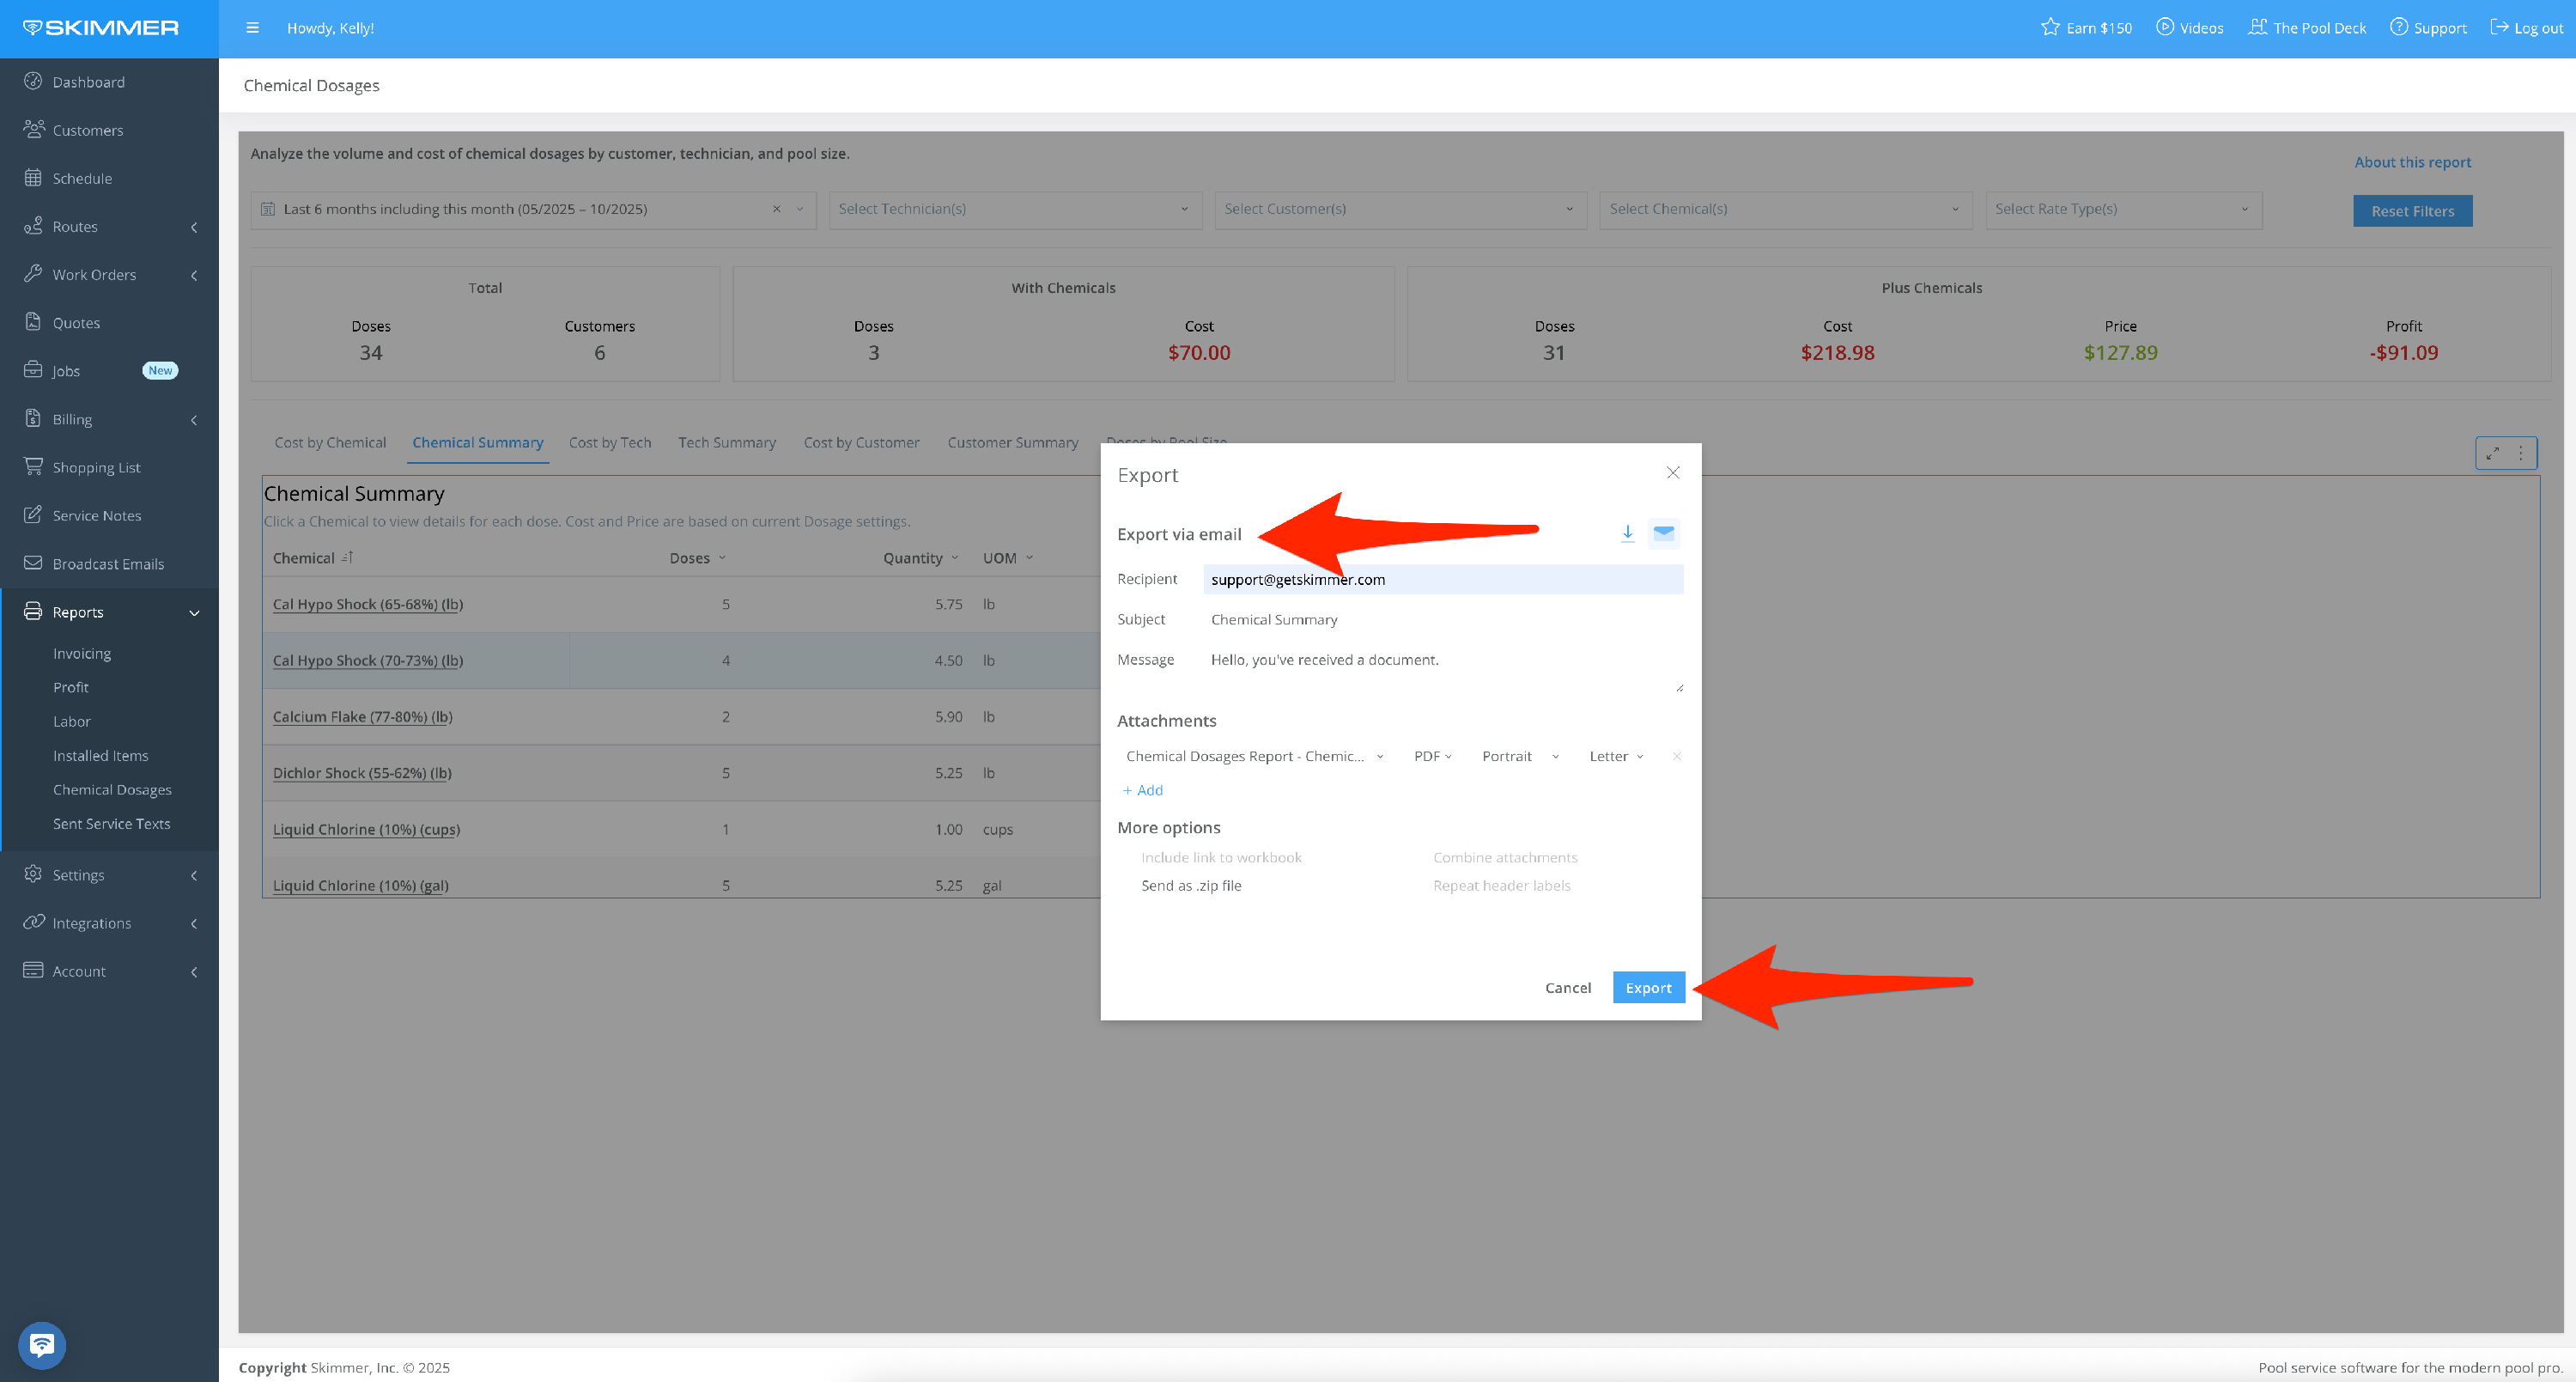
- You can also Send > Export, which also allows you email it. With the email option, you can also choose format and recipients, schedule a day and time for that email to send, and customize a schedule for a recurring email export going forward.
- 9
-
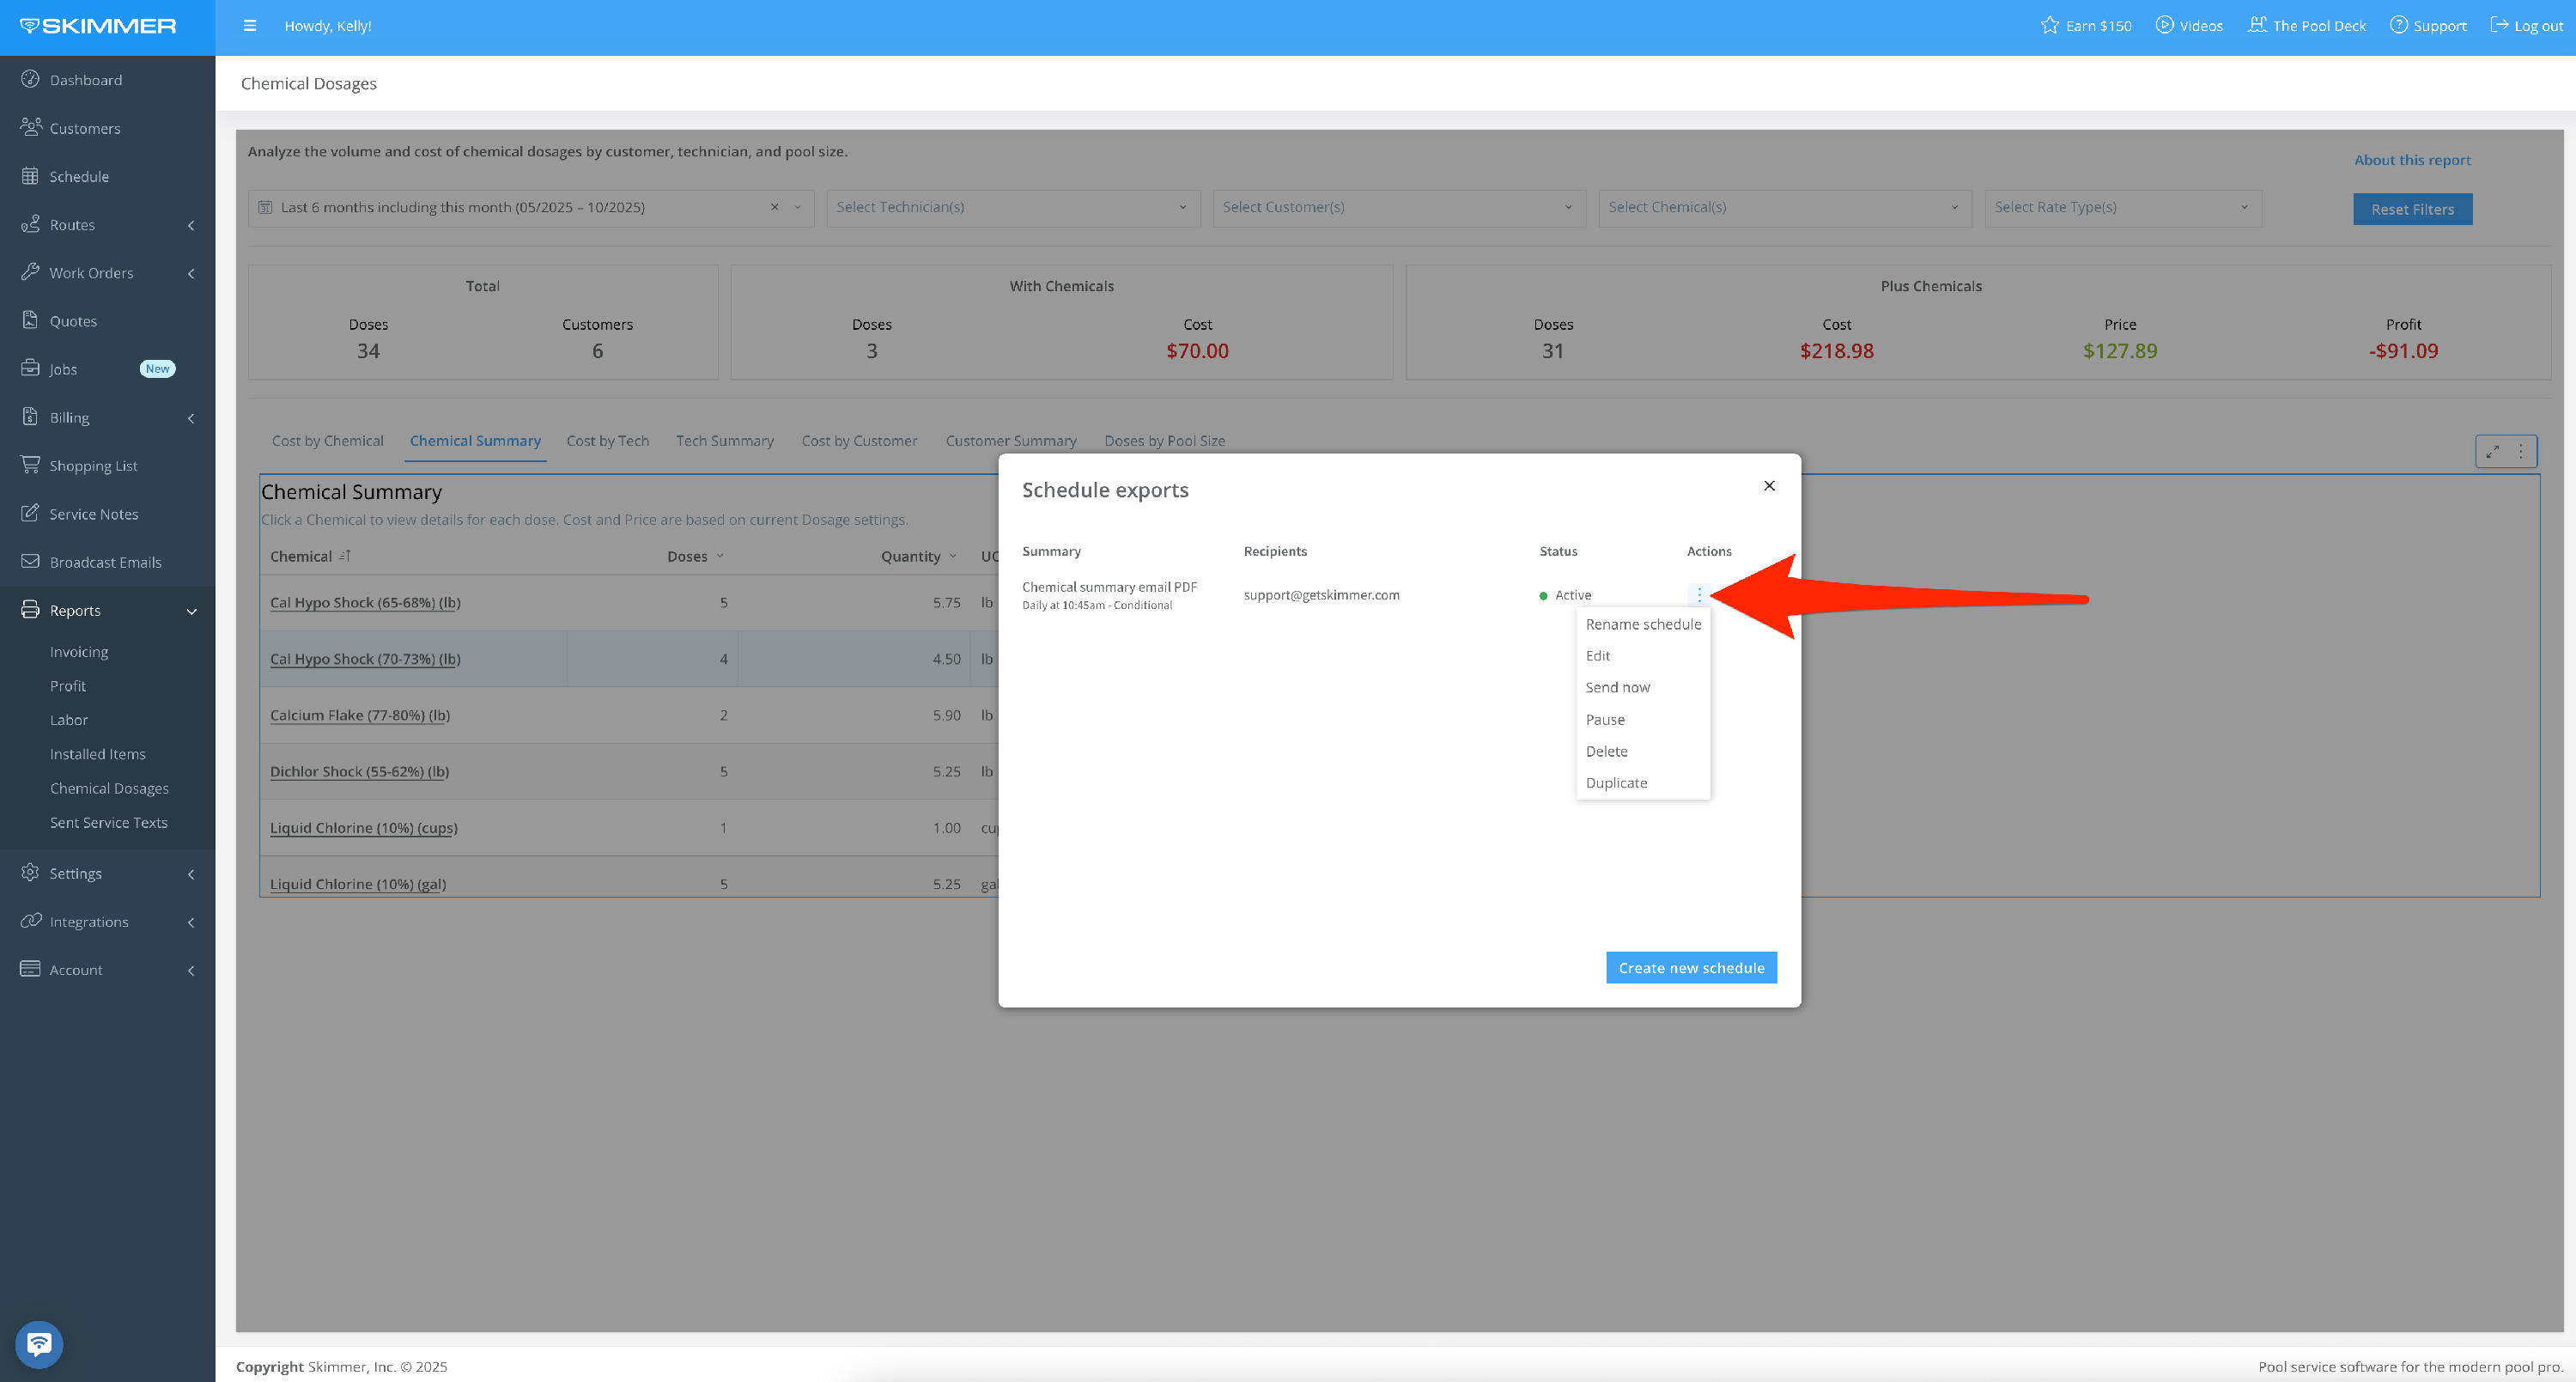
The “Alert When” option sets up an automatic export if the conditions you set are met. For instance, you can choose for the export to trigger if your cost exceeds a certain amount. The system does the monitoring of this condition for you and then triggers the export automatically. You can also select what supporting data you want to be included in the export, from a high-level summation to the whole text messages table. Once you create a scheduled export, you’ll have access to a table from which you can manage all of your scheduled exports, allowing you to edit/delete/duplicate/pause/manually send report at any time.