
Service Feedback Report
The Service Feedback report shows the ratings and comments your customers left for each stop, so you can see how you're doing without opening feedback one stop at a time.
Note: A stop stays open for feedback for 30 days. Most feedback comes in within a few days of the stop, so counts for the last few days of your date range may still go up.
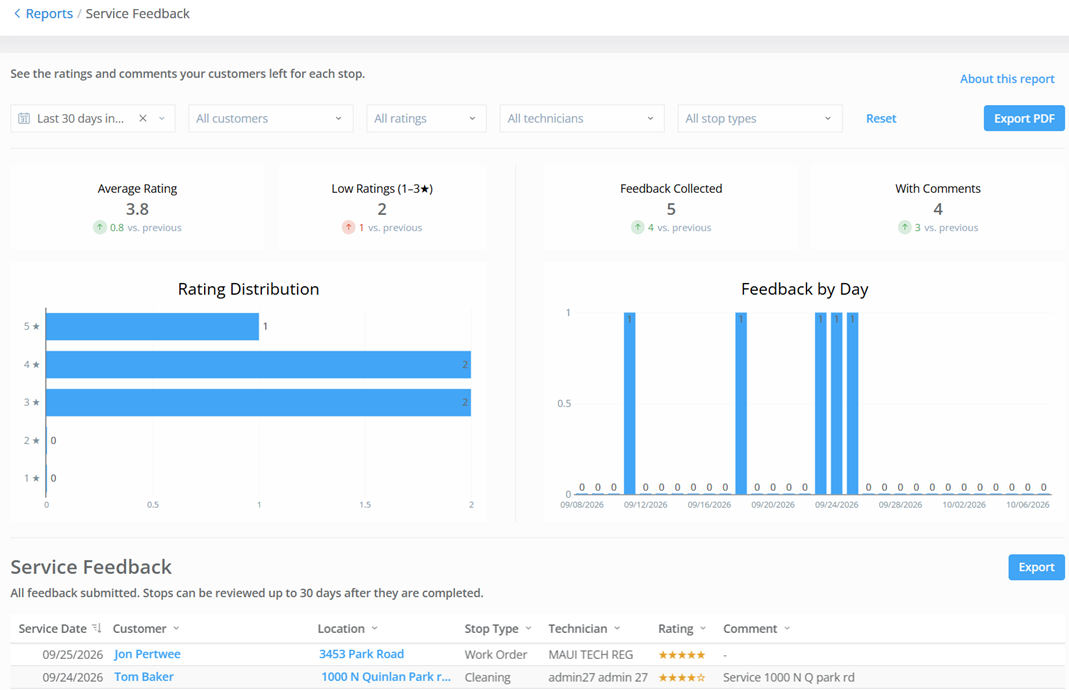
The Service Feedback report opens on a single page with rating and feedback totals, two charts, and a table of individual feedback responses. Select About this report at the top of the report for a quick summary of what's included.
When to use this report
- Weekly check — See your average rating and feedback volume at a glance, and catch a drop in feedback before it becomes a pattern.
- Follow up with unhappy customers — Filter to low ratings to find customers who need a call before they escalate or churn.
- Spot-check a technician — Filter by technician to see whether a complaint is a one-off or a pattern.
- Read what customers are saying — Scan comments to see what customers are actually praising or criticizing, not just the star count.
Report totals
Each total compares the selected date range to the immediately preceding period of the same length. For example, if your average rating was 3.6 the week you selected versus 3.9 the week before, the caption shows the rating trending down.
| Total | Description |
|---|---|
| Average Rating | The average star rating across all feedback responses in the date range. |
| Low Ratings (1–3★) | The number of responses rated 1 to 3 stars in the date range. Watch for this rising. |
| Feedback Collected | The total number of feedback responses for work completed during the date range. A drop can mean feedback requests aren't going out. |
| With Comments | The number of responses in the date range that include a written comment. |
Charts
| Chart | Description |
|---|---|
| Rating Distribution | A bar chart showing how many responses fall at each star rating, 1 through 5, so you can see the shape of your feedback, not just the average. |
| Feedback by Day | A bar chart showing how many responses came in on each day of the date range, so you can tell whether feedback is still coming in. |
Filter options
| Filter option | Description |
|---|---|
| Date | Defaults to the last 30 days, including today. Filters by service date. |
| Customer | Filters by one or more customers. |
| Ratings | Filters by star rating. |
| Technicians | Filters by one or more techs. |
| Stop types | Filters by stop type, cleaning or work order. |
Select Reset to clear all filters and return to the default 30-day date range.
Service Feedback table
The table lists every feedback response in the date range, excluding deleted responses.
| Column | Description |
|---|---|
| Service Date | The date of the stop the feedback is for. |
| Customer | The customer's name. Click to view the customer's profile. |
| Location | The service location the feedback is for. |
| Stop Type | The type of stop rated, cleaning or work order. |
| Technician | The tech who completed the stop. |
| Rating | The star rating the customer gave, 1 to 5. |
| Comment | The customer's written comment, if they left one. |