
Tech Performance Report
Tiers: Scaling Up and above
Report Category: Operations Reports
Location: Reports page > Tech Performance
Permission Required: Can view tech performance report
The Tech Performance report shows how much work each tech does, how long their stops take, and how customers rate them, side by side with your team average. Use it to spot who's excelling and who needs coaching, and to back up coaching conversations with real numbers.
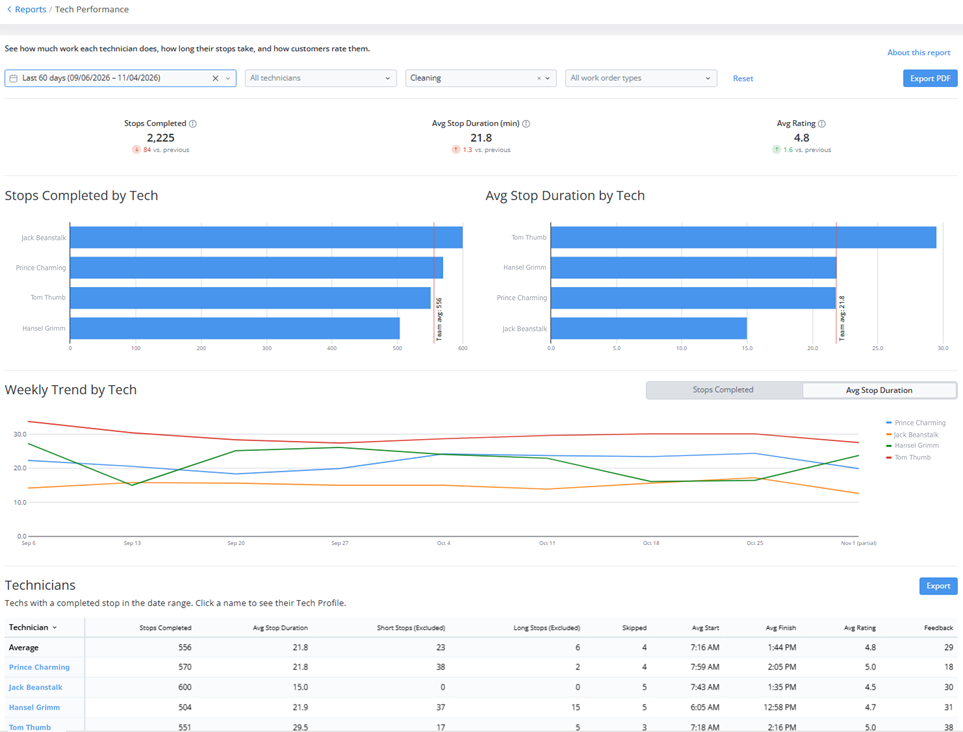
The report opens on the Summary page, which compares your whole team. Click a tech's name in the Technician table to open the Tech Profile page for that tech. Click About this report at the top right of the page for a quick summary of what's included.
When to use this report
- Weekly team check - See stops completed, average stop duration, and average rating for your team, and how each compares to the previous period.
- Prepare for a coaching conversation - Open a tech's profile to show them how their stops, time per stop, and ratings compare to the team.
- Catch a slip early - Watch the trend chart to see when a tech's stop duration or stop count starts to change, before customers complain or cancel.
- Compare similar work - Filter by stop type or work order type so techs who do more work orders aren't compared against techs who mostly do cleanings.
How stop duration and times are calculated
Stop duration is the time between when a tech starts a stop and when they complete it in the Skimmer mobile app. Avg Stop Duration counts only stops that fall in these ranges:
| Stop type | Counted in Avg Stop Duration |
|---|---|
| Cleaning | 1 minute to 2 hours |
| Work order | 1 minute to 4 hours |
Stops outside these ranges still count toward Stops Completed. They appear in the Short Stops (Excluded) and Long Stops (Excluded) columns instead of the average. Short stops usually happen when a tech finishes a stop to see the next one, forgets to start a stop on arrival, or taps Finish by accident. If a tech has a high count of short stops, it's worth checking how they use the app.
Keep these points in mind when you read the report:
- Start and finish times are the first stop started and the last stop completed each day, in your time zone. They aren't clock-in or clock-out times.
- All stop types combined: When you don't filter by stop type, cleanings and work orders count together. Techs who do more work orders show longer stop durations, so use the Stop type filter to compare similar work.
- Ratings come from Service Feedback. Most techs get only a few responses a month, so one rating can move a tech's average a lot.
- Costs and revenue aren't part of this report. For tech-level revenue, use the Profit report. For dosage details, use the Chemical Dosages report.
Summary page
The Summary page compares every tech on your team, with totals at the top, three charts, and a table of each tech's numbers. Use the filter options at the top of the page to narrow or expand your view.
Filter options
| Filter option | Description |
|---|---|
| Date | Defaults to the last 90 days through yesterday. Filters by service date. |
| All technicians | Filters by one or more techs. When you select techs, the totals, charts, and table show only those techs. Average lines on the charts read Selected avg instead of Team avg, and the Average row in the table shows the selected techs' average. |
| Stop type | Filters by stop type: All, Cleaning, or Work Order. The report opens on Cleaning, so it shows only cleanings until you change this filter. |
| Work order type | Filters by one or more work order types. |
Click Reset to return every filter to its default. Click Export PDF to save a copy of the page.
Report totals
Each total compares the selected date range to the immediately preceding period of the same length. Below the total, an arrow and number show how much the total went up or down. For example, if Stops Completed shows 106 with ↓ 144 vs. previous, your team completed 144 fewer stops than in the previous period, which had 250.

| Total | Description |
|---|---|
| Stops Completed | The number of cleanings and work orders your team completed in the date range, including stops left out of Avg Stop Duration. |
| Avg Stop Duration (min) | The average time techs spend on a completed stop. Excludes stops under 1 minute and stops over 2 hours (4 hours for work orders). |
| Avg Rating | The average customer rating, 1 to 5 stars, for stops in the date range. If the previous period has no feedback, no comparison appears. |
Charts
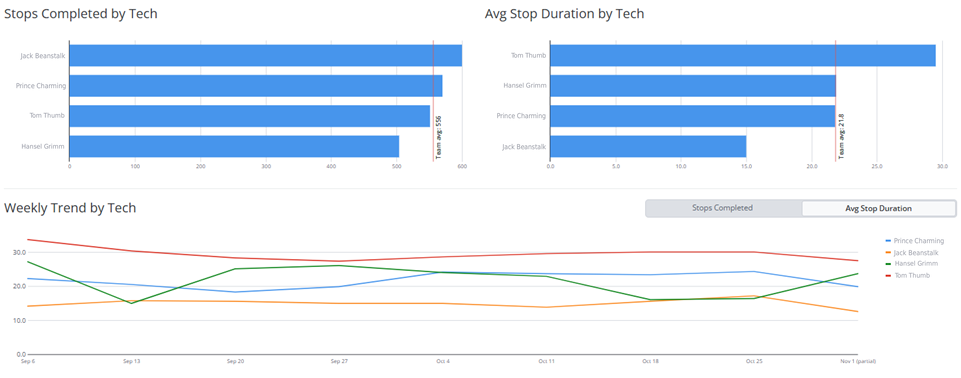
Click a tech's bar in either bar chart to see their stops. The trend chart groups data by day for date ranges up to 31 days, by week for ranges up to 92 days, and by month for longer ranges. Its title changes to match, and it labels an incomplete week or month (partial).
| Chart | Description |
|---|---|
| Stops Completed by Tech | A bar chart showing how many stops each tech completed, with a line for the team average, so you can see who's above or below it. |
| Avg Stop Duration by Tech | A bar chart showing each tech's average stop duration, with a line for the team average, so outliers stand out. |
| Daily, Weekly, or Monthly Trend by Tech | A line chart with one line per tech, so you can see who's improving or slipping. Choose Avg Stop Duration (the default) or Stops Completed. Click a tech's name in the legend to show or hide their line. |
Technician table
The table lists everyone with at least one completed stop in the date range. The Average row at the top shows your team's averages, or the selected techs' averages when you filter by technician, so you can compare each tech at a glance.

To sort the table, click the arrow next to the Technician column name. You can't sort by other columns. Click a tech's name to open their Tech Profile page.
To download the table, click Export above the table, on the right, then choose CSV, Excel, or PDF. CSV and Excel download the table as filtered, and PDF downloads the Summary page.
| Column | Description |
|---|---|
| Technician | The tech's name. Click to open the tech's profile. |
| Stops Completed | The number of stops the tech completed. |
| Avg Stop Duration | The tech's average time on a completed stop, not counting short and long stops. |
| Short Stops (Excluded) | Stops shorter than 1 minute. Not counted in Avg Stop Duration. |
| Long Stops (Excluded) | Stops longer than 2 hours (4 hours for work orders). Not counted in Avg Stop Duration. |
| Skipped | The number of stops the tech skipped. Skipped stops appear for context and don't affect the other numbers in the table. |
| Avg Start | The average time the tech started their first stop of the day. |
| Avg Finish | The average time the tech completed their last stop of the day. |
| Avg Rating | The average star rating customers gave for the tech's stops, 1 to 5. |
| Feedback | The number of feedback responses for the tech's stops. |
Tech Profile page
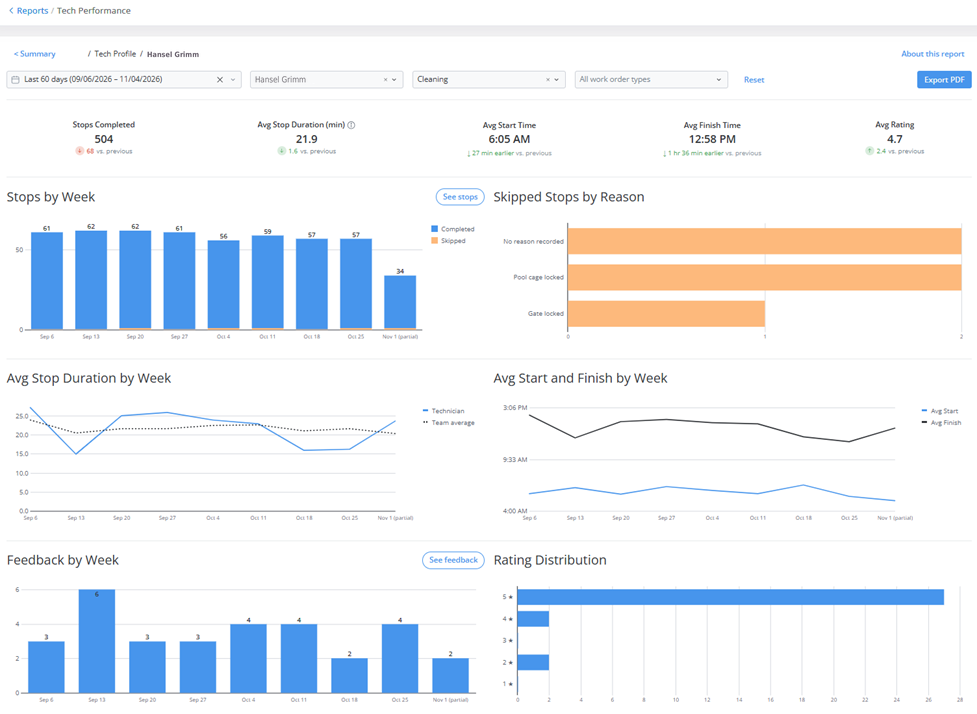
The Tech Profile page shows one tech's numbers and trends, so you can prepare for a coaching conversation. To open it, click a tech's name in the Technician table on the Summary page. To go back, click Summary at the top left of the page.
The Tech Profile page has the same date, stop type, and work order type filters as the Summary page, along with Reset and Export PDF. Reset returns the date, stop type, and work order type filters to their defaults and keeps the current tech. To switch to another tech without going back, choose a name in the technician filter, next to the date filter.
Report totals
Each total compares the selected date range to the immediately preceding period of the same length.

| Total | Description |
|---|---|
| Stops Completed | The number of stops the tech completed in the date range. |
| Avg Stop Duration (min) | The tech's average time on a completed stop, not counting short and long stops. |
| Avg Start Time | The average time the tech started their first stop of the day. A red up arrow means the tech is starting later than in the previous period, and a green down arrow means earlier. |
| Avg Finish Time | The average time the tech completed their last stop of the day. A red up arrow means the tech is finishing later than in the previous period, and a green down arrow means earlier. |
| Avg Rating | The average star rating customers gave for the tech's stops. If the previous period has no feedback, no comparison appears. |
Charts
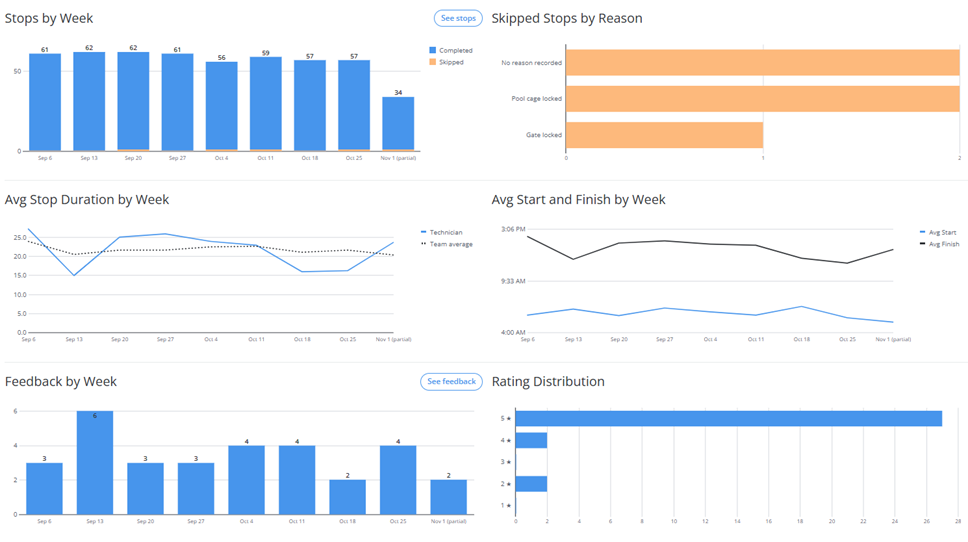
In chart titles, [Period] changes to Day for date ranges up to 31 days, Week for ranges up to 92 days, and Month for longer ranges.
| Chart | Description |
|---|---|
| Stops by [Period] | A bar chart showing the tech's completed and skipped stops over time, with a total on each bar. Click See stops to open the tech's stop list. |
| Skipped Stops by Reason | A bar chart showing how many stops the tech skipped for each skip reason. |
| Avg Stop Duration by [Period] | A line chart comparing the tech's average stop duration to the team average over time. |
| Avg Start and Finish by [Period] | A line chart with two lines, the tech's average start time and average finish time, so you can see whether their day is shifting. |
| Feedback by [Period] | A bar chart showing how many feedback responses came in for the tech's stops. Click See feedback to open the tech's feedback list. |
| Rating Distribution | A bar chart showing how many responses fall at each star rating, 5 through 1, so you can see the shape of the tech's feedback, not just the average. |
Stops: [tech name]
Click See stops next to the Stops by [Period] chart title to open a list of the tech's stops. You can also open it by clicking a tech's bar in either bar chart on the Summary page. Stops are listed newest date first, in the order they started each day. Click Close to return to the Tech Profile page.
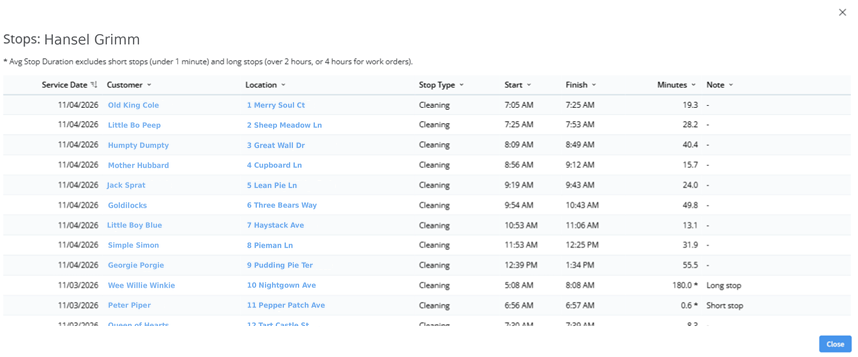
| Column | Description |
|---|---|
| Service Date | The date of the stop. |
| Customer | The customer's name. If you have permission to view customers, click it to open the customer in a new tab. |
| Location | The service location's street address. If you have permission to view customers, click it to open the service location in a new tab. |
| Stop Type | The stop type, such as Cleaning or Work Order. |
| Start | The time the tech started the stop. Blank for a skipped stop. |
| Finish | The time the tech completed the stop. Blank for a skipped stop. |
| Minutes | The stop's duration in minutes. An asterisk (*) marks a short or long stop, which isn't counted in Avg Stop Duration. Blank for a skipped stop. |
| Note | Shows Short stop or Long stop for stops left out of Avg Stop Duration, and Skipped: [reason] for skipped stops. If no reason was recorded, it reads Skipped: No reason recorded. |
Service feedback: [tech name]
Click See feedback next to the Feedback by [Period] chart title to open a list of customer ratings for the tech's stops. The list shows the newest ratings first. To sort by a different column, click its header. For example, click Rating to put the lowest ratings on top. Click Close to return to the Tech Profile page.
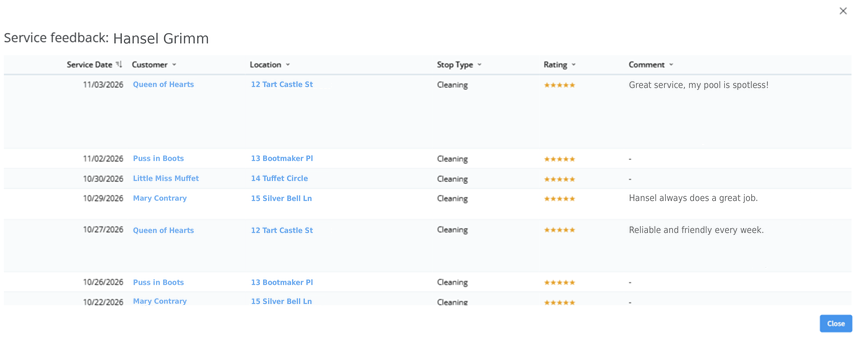
| Column | Description |
|---|---|
| Service Date | The service date of the rated stop. |
| Customer | The customer's name. If you have permission to view customers, click it to open the customer in a new tab. |
| Location | The service location's street address. If you have permission to view customers, click it to open the service location in a new tab. |
| Stop Type | The stop type, such as Cleaning or Work Order. |
| Rating | The star rating, 1 to 5. |
| Comment | The customer's comment. Shows a dash (-) when there's no comment. |